Talk to us
 Investment Management
Geopolitical Tensions & New Economic Data—Implications for Portfolios


August 8, 2023

The Federal Reserve (the Fed) has been hiking rates for approximately 16 months, beginning last March. Since then, it has raised rates to 5.5%. This has been the swiftest rate-hiking cycle in more than 40 years. During these cycles, some things tend to break (like the regional bank crisis earlier this year), but other things tend to get squeezed over time. Generally, it takes between one to two years for things to play out after a rate hiking cycle begins. We’re squarely in that window of time now.
Naturally, the Fed’s rate hikes have caused inflation to cool, but we may not be out of the woods quite yet. While stabilizing, GDP growth is low and could turn negative, portending a recession in the coming quarters. Among other factors driving that potential outcome, household excess savings (primarily related to the transfer payments during the pandemic) are dwindling and could deplete over the next few quarters. And at the same time, households have turned to expensive credit cards and home equity lines of credit (HELOCs) to continue spending and speculating. That’s despite average credit card rates exceeding 20% and average HELOC rates around 9%. Astonishingly, so many people are willing to buy now and pay (a lot more) later to maintain their lifestyles. The combination of these factors leads us to believe the economy is now, or may soon be, sucking wind.
From our perspective, the market environment is chock full of risks and uncertainties that most investors are looking past, but:
So, while most financial asset classes are expensive, with some priced to perfection, including U.S. large cap and growth stocks, there are still plenty of assets worth owning.
Inflation is cooling but is still well above the Fed’s target of 2%. The reduction in headline inflation, which includes the more volatile components of energy and food, recently garnered a lot of press. However, at 4.8%, Core Inflation (which excludes energy and food) remains materially higher than the Fed’s target. And, since Dec. 2019, wage gains are still lagging; what we call “necessities inflation” by 5% cumulatively. Core Inflation could remain stubbornly above the Fed’s target, buoyed by labor and housing costs, each of which tends to affect inflation on a lagged basis.
High cash rates offer a reasonable alternative to expensive equities, bonds and speculative investments. Likewise, high borrowing rates tend to reduce corporate earnings and dissuade corporate investments and share buybacks. We believe the Fed will likely remain hawkish as inflation continues to bite, especially the most vulnerable people among us. But that could mean further rate increases or holding rates at their current levels for longer.
The labor market has, more or less, fully recovered from the pandemic shock in early 2020. Unemployment has fallen from its peak of 14.7% to 3.6% as of June of this year and sits near a record low and similar to its reading at the end of 2019. Job openings relative to the number of unemployed have fallen a bit but remain well above the one-to-one readings observed in other full-employment periods. The percentage of prime-age adults, those aged 25 to 54, in the labor force is at a 20-year high. All of those statistics are positive. However, tight labor markets create some challenges. Firstly, the growth in labor, new workers and hours worked is a key factor of production. With fewer available unemployed workers, the productive capacity of the economy is constrained and can lead to lower GDP growth. Secondly, as we have seen over the past year or two, competitive labor markets usually result in higher wage gains and create or aggravate existing inflationary pressures.
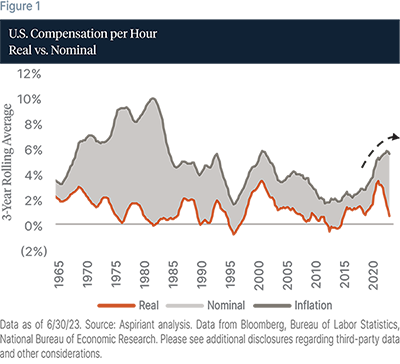
Figure 1 shows a three-year rolling average of hourly compensation over the past 50 years. The gray line is nominal wage growth; the orange line is real wage growth and the gray shading or the difference between the two inflations. Nominal wage growth is at 30-year highs and has caused many companies to pass along these higher costs in the form of higher prices. Unfortunately for workers, inflationary pressures have taken up more of these wage gains such that real hourly compensation is now similar to the gains in the post-global financial crisis years. In any event, current annual nominal wage growth is running about a point or two higher than needed to get inflation back to the Fed’s two percent target.
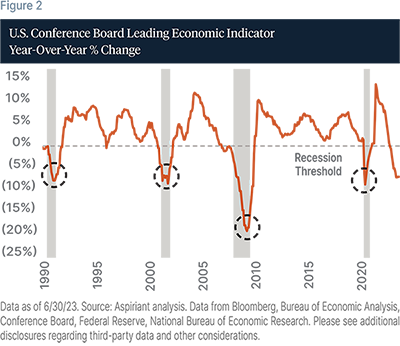
The Conference Board’s Leading Economic Indicators data in Figure 2 tell the same story. The Leading Economic Indicators show a sharp deceleration in economic activity across a range of metrics, including new orders for manufactured goods, new housing building permits, and average weekly hours. In October of last year, the Leading Economic Indicators had dropped to a roughly zero percent year-over-year change. Not particularly worrisome but well off the positive 12% gain of April 2021. Today, these leading economic indicators are falling at a rate of -7.9%, a threshold usually marked by recessions, as highlighted with the gray shading.
The projected real GDP growth rate for 2023 is 1%, just a touch above stall speed. Approximately 70% of the U.S. economy is driven by consumer spending, and consumer spending is financed by three sources: income, savings and credit. Incomes have held up with the strong job market, but, in the aggregate, will expand at a slower pace as there are fewer unemployed workers to pull into the labor market. Savings have been drained, especially among lower income households. And finally, credit is less available and considerably more expensive, given the rise in interest rates. The underpinnings to drive strong consumer spending look to be fading and, if so, will be a drag on overall economic growth in the months ahead.
Not only can Artificial Intelligence and other forms of speculation boost equities, so too can buyers in the private and public sectors. For example, companies can buy their own stock (a.k.a. share buybacks) and buy another company’s stock or assets (through mergers and acquisitions). Likewise, governments, including central banks can purchase financial assets. While either of these buyers can support equity valuations for a while, unless the transaction provides economic synergies or efficiencies, their effects tend to be temporary, eventually diffusing until valuations come back down toward their long-term averages.
Figure 3 shows merger and acquisition activity is linked to the economy and markets. The orange line plots aggregate deal value and the gray bars plot recessions. In each of the TMT and GFC, you can see the orange line began falling shortly before recessions began. And, when the orange line was ascending, no recessions occurred. There’s a handful of years between 2015 and 2020 when M&A was roughly flattish. Then, COVID-19 happened and M&A likely would have fallen, but instead advanced due to the massive stimulus programs. More recently, as the stimulus has been waning, the orange line has been in a freefall, which we’ve extended into 2023 with the dashed blue line. If historical relationships hold, we could indeed find ourselves in a recession in the coming quarters.

Today, bankers appear seemingly unable to convince executives to buy other companies. So, why are executives holding off? Is it because valuations are too high? Is it because rates are too high? Or is it both? If companies aren’t willing to buy the shares of their competitors, partners, suppliers or distributors, why are investors readily doing so? Notably, corporate buybacks have also turned downward. It seems that executives aren’t even willing to buy their own stock at today’s prices.
Global central banks are joining these executives on the sidelines. Historically, central banks across developed and developing countries generally used their balance sheets prudently to support their economies and financial markets. Collectively, their total balance sheets ebbed and flowed between 0% and 5% of Global GDP. But, during COVID-19, central bankers sprang into action, investing between five to six times the average aggregate holdings over the previous ~20 years. Those massive asset purchases injected trillions of dollars – by our count, roughly $10 trillion – of monetary liquidity into their economies and financial markets. And, the price we’re all paying today? It’s the highest cost of inflation in decades, which was spurred, in part, by these decisions. Given stubbornly high inflation across most countries, we expect central bank holdings to continue to recede. If and as they do, we’d expect equities, especially expensive equities, to face headwinds in the years to come.
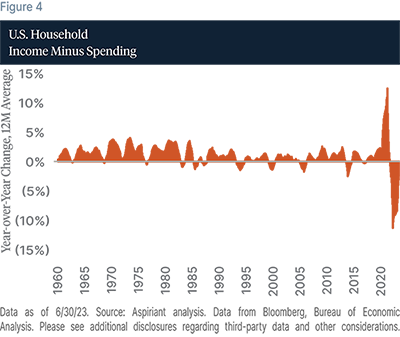
While consumers have been in good shape, which may explain their high confidence levels, their fortunes may be turning in the not-too-distant future. Figure 4 compares the growth, or change, in spending versus the growth, or change, in incomes. Typically, the income level exceeds spending so households can save a portion of their incomes. But, if spending increases at a faster pace than income, household savings rates fall, making consumers more vulnerable in an economic downturn. We’ve been concerned about the pace of consumer spending relative to the pace of incomes.
According to the JPMorgan Chase Institute, the average American’s bank account balances jumped by ~60% from 2019 to 2021. 60 percent! Now, that was a nice windfall. But, like the good Americans we are, we’ve collectively spent down those cushions to just ~11% today.
Thinking about how much longer those cushions will hold, JPMorgan also estimates, based on bank account balances, how many days of “normal” spending an account holder has. Typically, the days of spending are incredibly stable from year to year. If we compare 2010 to 2021 and 2023, the highest quartile earners had 27 days of reserves in 2010, which increased to 43 days in 2021 but is now back down to 35 days in 2023. That doesn’t seem like much of a cushion for your top-quartile earners. It is even more disturbing when you look at the lowest quartile. That cohort started 2010 with 13 days of reserves, which increased to 22 days in 2021 and is now back down to just 16 days. What is the primary culprit eroding the cushions? Yep, you guessed it, inflation.
Figure 5 zooms out from individual account holders to the overall economy. It’s one of our most insightful pieces of research when it comes to assessing “how long will the effects of the stimulus last?” Excess savings swirling around the economy over the past few years could soon be depleted. The dashed black line shows the trend in personal savings, assuming the pandemic relief programs were never offered to households. As you can see, as the benefits and transfers started dropping into bank accounts, excess savings (the amount above the trendline) ballooned by a whopping $2.1 trillion (the light gray area on the chart). At the time, the amount was about 10% of our entire country’s GDP.

Since the summer of 2021, we have drawn down approximately $1.6 trillion (the dark gray area) of excess savings. As a result, as of this March, an estimated ~$500 billion is all that remains. Currently, we’re burning through (or dissaving) approximately ~$85 billion per month. At this run-rate, excess savings will be depleted and we’ll be back to the pre-pandemic trendline around the fourth quarter of this year. Naturally the timeline could be shortened or extended, depending on the pace of the drawdowns, or we could reset to a lower trendline if consumers don’t sufficiently curtail spending in the future.
All of this leads us to believe that households may not be in as good of shape as they appear. Moreover, their consumption patterns may downshift in the future. In that scenario, both the economy and equities will come under pressure.
It appears to us that speculators have been scorching the earth moving from one speculative asset or idea to another. And, back-and-forth. While some have made money, many more have lost, causing them to become ever more desperate to recoup those losses. The path has burned through meme stocks, Cathy Wood’s ARKK ETF, Special Purpose Acquisition Companies (or SPACs), IPOs (especially those with negative earnings), cryptocurrencies (including their platforms and exchanges), Zero Days to Expiration (or 0-DTE) options, which are a bet that the market will go up or down on a given day, Artificial Intelligence, including the related chipmakers and programming platforms and, more generally and recently Big Tech stocks.
The stock market has moved considerably higher during the year, despite an uneven economic picture, and that advance is not due to expanding profits. In fact, profits in the first half of the year and full-year estimates are expected to be flat or down from 2022. Market returns year to date are solely a function of higher valuations leaving U.S. markets (especially Large Cap and Large Cap Growth) across a range of metrics, priced at or near historical highs. For example, the total U.S. market cap to U.S. GDP typically averages around 0.9x, with most values clustered from 0.5x to 1.3x. Today, U.S. companies are worth 1.8x U.S. GDP, exceeding the TMT bubble’s top. The only periods with greater values are the pandemic years of 2020 and 2021, when policy interest rates were at zero percent, not north of five percent as is the case today.
Another characteristic of this market rally has been the incredibly narrow market breadth. Today, Big Tech companies account for 32% of the total market capitalization of the S&P 500– twice the level of the TMT peak. And within Big Tech, the seven largest stocks are responsible for 75% of the S&P 500 gain of 16.9% year to date. If you strip out the 52% composite return of those seven stocks, the rest of the S&P 500, or the 493 stocks, are up collectively just 4.2% for the year.
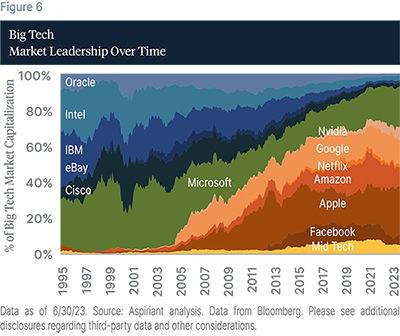
Many investors may think that these Big Tech companies are great businesses with little future risk of displacement. The same was probably said of the Big Tech companies of the late 1990s. Figure 6 shows the Big Tech leaders over time. On the far left are the leaders in the 1990s, led by Microsoft on the bottom in green, and Cisco, eBay, IBM, Intel and Oracle in various shades of blue. Interestingly, the companies in the blue – again Cisco, eBay, IBM, Intel and Oracle – represented about 68% of Big Tech’s market cap in the 1990s. At that time, all would have been considered strong businesses. But as you move through time, those Big Tech leaders lost their way and yielded to the next generation of Big Tech leaders in orange – Facebook, Apple, Amazon, Netflix, Google and Nvidia – and today amount to just 8% of Big Tech market cap. Only Microsoft managed to bridge the two eras and maintain a leadership position.
Let’s next look at how the prior collection of Big Tech leaders fared around the TMT run up and collapse. Figure 7 shows in the seven years prior to the TMT peak, the S&P 500 generated annualized returns of 21.5%, the blue bar on the far left, driven in part by the extraordinary returns of the Big Tech leaders. Those companies delivered a staggering 53.4% annualized return in the seven years prior to the TMT peak, the third bar from the left in the lime green. Over the subsequent seven years, the S&P 500 realized a modest 1.8% annualized gain. Big Tech fared even worse, falling -8.8% per year over those same seven years. Microsoft, the lone surviving leader among the Big Tech names, did not do much better and posted negative annual returns of -6.9% over the next seven years. Even big, successful companies can stumble and, if they are big enough and highly correlated to one another like the Big Tech names, they can both enhance and impair the returns of a broad index.

Government responses to COVID-19 and its after-effects have been enormous. First, we had trillions and trillions of dollars of monetary and fiscal stimulus to arrest the economic and health suffering triggered by the pandemic. Those actions were soon followed by the most aggressive monetary tightening in decades to correct for the inflationary impulses that arose out of the measures taken in 2020 and 2021. Given the magnitude of these actions and responses, it is hard to know precisely what will come next. On one hand, employment has remained surprisingly resilient with the U.S. at or near full employment. Inflation too, is trending in the right direction but is projected to remain above target into 2025. On the other hand, leading economic indicators have deteriorated for the last several months and are now at levels consistent with prior recessions. Real GDP growth for the U.S., Europe and China, or roughly 55% of the global GDP, is currently at 2% or less. Some consumer spending has held up, but with a great assist from the now largely depleted excess savings accumulated in the months immediately after the onset of the pandemic. Consumer credit is expanding even as it gets more expensive and harder to qualify. And business loan demand is weakening, as are other forms of corporate investment, including M&A.
Despite this mixed outlook, U.S. equity markets, the S&P 500 in particular, marched higher. Expanding valuations, not greater earnings, have driven the climb in share prices. Across any number of metrics, valuation multiples are well above historical averages and in some cases, such as market cap to GDP, above prior peaks recorded around the TMT or tech bubble of the late 1990s. Returns are increasingly concentrated in a thin slice of the market, with Big Tech companies accounting for over 30% of the market cap for the S&P 500 and the largest names responsible for 75% of the index return year to date. Today’s leaders can become tomorrow’s laggards as innovation, regulation, size or stretched expectations can upend future performance and pull returns down for a small subset of companies and the overall market.
With that economic and market backdrop, we believe now is not the time to chase after more speculative and expensive opportunities with little to no margin of safety. In our view, diversification not concentration is the more sensible path. We see plenty of opportunities that offer strong expected returns and due to more attractive valuations can better withstand any hiccups in future economic growth or financial results. Within equities, those areas include value versus growth, and international stocks over the U.S., particularly in large cap growth. We do see continuing benefits of holding diversifying exposures, should inflation remain sticky and interest rates stay higher for longer, which will further pressure fixed-income returns. Defensive equities, or stocks of companies with more durable and stable profits, remain a key holding in the portfolio. And, where appropriate, select private market allocations to areas such as private credit, real assets, and secondaries, among others, allow investors to take advantage of dislocations and further broaden portfolio diversification.


Aspirant is an investment adviser registered with the Securities and Exchange Commission (SEC), which does not suggest a certain level of skill and training. Additional information regarding Aspiriant and its advisory practices can be obtained via the following link: www.aspiriant.com.
Information contained herein is considered confidential, private and Aspiriant proprietary inside information that is intended only for the audience to which Aspiriant has knowingly distributed this presentation to, either by way of request or voluntarily. Any redistribution of this material without our prior express written permission is a violation of Aspirant’s privacy policy adopted to comport with various state and federal privacy laws that may subject any unauthorized distributor to legal action.
All opinions, figures, charts/graphs, estimates and data included in this document are as on date and are subject to change without notice. The statements contained herein may include statements of future expectations, for general market performance or economic conditions, and other forward-looking statements that are based on our current views and assumptions and involve known and unknown risks and uncertainties that could cause actual results, performance, or events to differ materially from those expressed or implied in such statements. Forecasts, projections and other forward-looking statements are based upon assumptions, current beliefs and expectations. Forward-looking statements are subject to numerous assumptions, estimates, risks and uncertainties, including but not limited to: economic, business, market and geopolitical conditions; U.S. and foreign regulatory developments relating to, among other things, financial institutions and markets, government oversight, fiscal and tax policy. Any forward-looking information should not be regarded as a representation by Aspiriant or any other person that estimates or expectations contemplated will be achieved, as the future is not predictable.
Past performance is not indicative of future results. There can be no assurances that any strategy will meet its investment objectives. All investments can lose value. The performance and volatility of an investor’s portfolio will not be the same as the index. Indices are unmanaged and have no fees. An investment may not be made directly in an index. The data used in this material was obtained from third-party sources the firm believes are reliable and internally. Aspiriant is not responsible for the accuracy of any third-party data used in the construction of this presentation. This information alone is not sufficient and should not be used for the development or implementation of an investment strategy. It should not be construed as investment advice to any party. Investing in securities, such as equity, fixed income and mutual funds, involves the risk of partial or complete loss of capital that prospective investors should be prepared to bear. Any reference to securities, directly or indirectly, is not a recommendation and does not represent a solicitation to buy or an offer of a solicitation to sell such securities. Any statistical information contained herein has been obtained from publicly available market data (such as, but not limited to, data published by Bloomberg Finance L.P. and its affiliates), internal research and regulatory filings.
Gross domestic product (GDP) measures the monetary value of final goods and services produced in a country in a given period of time. TMT is Technology, media and telecom. Refers to the 2000 stock market crash, due to the overvaluation of stocks and bursting of the dot-com bubble.
GFC is the Global Financial Crisis.
Covid is the COVID-19 health pandemic.
The S&P 500 is a market-capitalization weighted index that includes the 500 most widely held companies chosen with respect to market size, liquidity and industry.
Want the latest wealth management tips, investment insights and Aspiriant news delivered straight to your inbox. Sign up for regular Fathom updates so we can send you the most relevant content you selected below.