
IS&R Highlights
- After building for years, the inflation wave is cresting and could crash.
- If the Fed tightens too quickly, it risks recession. Tightening too slowly risks stagflation.
- Consumer spending is unlikely to boost Real GDP growth going forward.
- Lower GDP growth could lead to higher unemployment.
- The risks of a recession are not reflected in corporate profit expectations.
- If unemployment begins to rise and/or growth slows, the Fed could pause its rate-raising after September.
- Given the wide range of possibilities, diversification across geographies and asset classes is especially important today.
Shifting Currents
In 2019, we wrote about the riptide effect globalization had on the economy and markets. At that time, U.S. stocks were in a seven-year bull market that continued until this year, and consumers benefited from low prices due to competition and low interest rates.
Today, the tides have decidedly turned. The tsunami of monetary and fiscal stimulus in recent years swelled consumer demand. Those pressures were exacerbated by supply chain disruptions, including those caused by Russia’s war with Ukraine and lockdowns in China. The combination of these factors pushed inflation to a 40-year high, which is threatening consumers around the world. Moreover, the power surge of nationalization and receding level of globalization may cause inflationary risks for many years to come.
All of this has produced unsettling market volatility with many investors searching for a lifejacket to keep them afloat. But despite all the tough challenges, our Investment Strategy & Research team is seeing some great opportunities in the shifting currents ─ in fact, the best we’ve seen in a decade.
This Insight examines where we are today, how we got here and where we may be headed. We’ll discuss the Federal Reserve’s potential actions, whether any resulting volatility could dip us into recession or stagflation, and what that could mean for long-term investors.
How did we get here?
Inflation is affecting all of us. To form a view about what could happen going forward, we first have to understand what got us here in the first place. The reality is a powerful inflationary wave has been building for years. It’s just now cresting and could very well crash in the months ahead.
So, how did we get here? Well, the story goes back to lessons our policymakers learned coming out of the Global Financial Crisis (GFC) in the late 2000s. We pulled out of that downward spiral by implementing extraordinary fiscal and monetary policies that propelled a slow moving, but strong and rising current of prosperity. Collectively, we have benefited from the stimulative policies ─ specifically, low interest rates and deficit spending ─ which allowed us to have jobs, spend more and grow faster. It’s important to recognize that the prevailing low-inflationary environment was the primary reason we enjoyed that bountiful period. By contrast, if the environment had been inflationary, policymakers would have had to bring the party to an end by raising interest rates years ago.
But we were given some gifts. At the same time stimulative polices were spurring inflation, equally powerful and offsetting deflationary forces were at play, including debt deleveraging and rapidly advancing globalization, among other factors. As a result, the net inflationary environment was muted.
Then, COVID-19 triggered an economic landslide causing policymakers to recall what they had learned during the GFC. So they responded with a downpour of financial liquidity. They pumped roughly $6 trillion in fiscal and monetary stimulus into the economy, setting in motion a massive wave of consumer demand that triggered inflationary pressures for everything: from goods and services, to labor and wages, to commodities and other production inputs, to homes and real estate, as well as financial investments.
Next, a slew of supply chain disruptions occurred across the globe due to limited physical and human capital related to trade disputes, military conflict, outdated infrastructure and labor protests, among other factors. The result? Over the past two years, the Headline Consumer Price Index (CPI) is up 15% cumulatively and Core CPI (which excludes food and energy) is up 11%.
Everyone is feeling the pain, but the most vulnerable among us are getting hit the hardest, due to expired or expiring stimulus benefits and transfers, including child tax credits and (potentially) some student lunch programs.
That’s how we got here. So, where are we headed?
Where are we headed?
When establishing monetary policy, the Fed follows its dual Congressional mandate of ensuring maximum employment and price stability. Given the challenges it’s facing today, it looks like their choices are more like “duel,” as in dueling headaches.
Tightening too quickly to quell inflation will likely lead to increasing unemployment and risks recession or negative real economic growth. And, based on the Commerce Department’s second quarter GDP reading, the U.S. economy has just met a technical condition of a “recession.” On the other hand, tightening too slowly to support growth, will likely lead to elevated inflation and risks stagflation, known as a recession with inflation, meaning we’d collectively be a lot worse off than we were previously. And since tightening works on a lagged basis, the Fed will not know if it made the correct decision for months to come.
While not acknowledging we’re in a recession yet, Fed Chairman Jay Powell has recognized the narrowing opportunity for the Fed to achieve a “soft landing” given these challenges.
Regardless of the decisions it makes, everyone will likely continue to feel the pain, but it’s important to understand who is more likely to bear the brunt of the burden. If the Fed’s actions induce a recession, as determined by the National Bureau of Economic Research, then those who become unemployed and lose their incomes and economic security will clearly be on the front line. Conversely, if their policy decisions produce stagflation, all consumers will continue to hurt due to higher prices, especially those living paycheck-to-paycheck and struggling to make ends meet.
From an investment standpoint, in either a recession or stagflation, the two worst performing asset classes have historically been broad-based equities and real estate, especially on a risk-adjusted basis. So, one has to be intentional about the amount of stocks and types of businesses to own in those environments.
The Fed is in a tough spot, and the decisions it makes to navigate the crosscurrents will influence the direction of inflation, interest rates, unemployment, economic growth and investment returns. It basically has three choices:
- Persist ─ Continue to increase interest rates consistent with the market’s expectations.
- Pause ─ Raise the federal funds rate again at the September policy meeting, but then pause.
- Pivot ─ Reverse course and reduce the federal funds rate over the next few quarters.
The market currently expects, based on Fed guidance, to get to 3.25%–3.5% by the end of the year and then ease in 2023. After July’s increase, we are currently at 2.25%–2.5%.
We think the highest probability scenario is a Fed pause and the lowest likely scenario is Fed persist. If they march all the way to 3.25% or 3.5%, a pivot would be more likely to follow.
Inflation and rates
Inflation is currently experiencing the fastest increase since the 1980’s and 1970’s (Figure 1). Once again, we believe an inflationary current has been building for decades, and the $6 trillion in stimulus caused it to surge over the past two years.
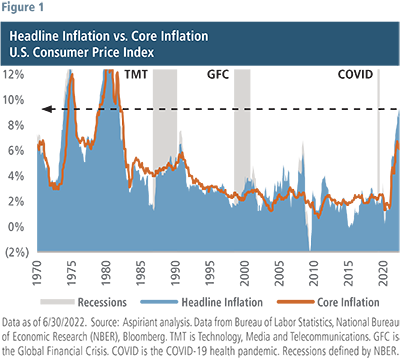
The chart plots the year-over-year percentage change in Headline Consumer Price Inflation (or CPI). The blue area is the annual percentage increase in the price of a basket of goods and services. For example, as of June, the year-over-year increase in goods and services was 9.1%. The orange line measures Core CPI, which excludes the most volatile components of inflation, food and energy. As a result, the orange line is a bit more stable.
High inflation pressures the Fed to raise interest rates. At the same time, weakening employment and real economic growth might cause it to pause in the months ahead.
Figure 2 shows the shift that has occurred over time to the prevailing level of interest rates across various bond maturities, commonly known as the Yield Curve. In June 2007, as the GFC was expanding, the Fed had ample ability to reduce interest rates to spur growth (with approximately 4% on shorter rates and about 5% on longer rates). And they did indeed drop rates down to the floor to help pull the economy and financial markets out of the crisis.
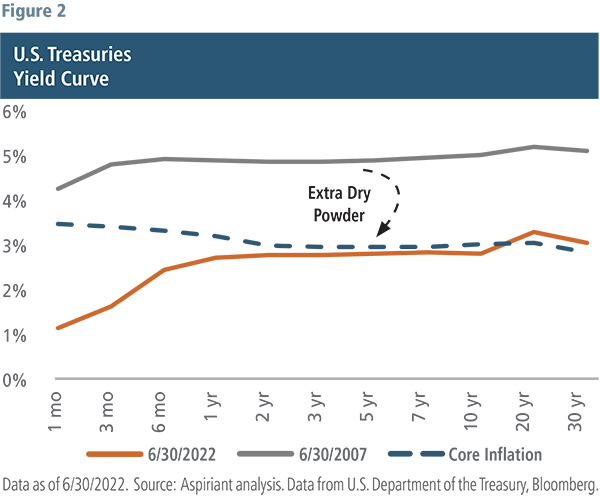
By the end of the second quarter this year, the Fed’s ability to reduce rates to stimulate growth is significantly less compared to what was needed in the GFC. The market isn’t expecting much more headroom a year from now. On the short end of the curve, the Fed is expected to continue raising rates to quell inflation, but a Fed pause could occur between now and then. And, on the long end of the curve, two large buyers of Treasurys (the Fed itself along with U.S. banks) have become sellers, meaning they are reducing the dollar amount of bonds on their balance sheets as we move from a period of Quantitative Easing (which tends to suppress long-term rates) to Quantitative Tightening (which tends to support long-term rates). So, the Fed’s current policies mean higher long-term rates.
At this point, the Fed has prioritized taming inflation by driving interest rates upward, as evidenced by the increase of 75 basis points on the Fed Funds Rate in July. But at the same time, economic strength is exhibiting some early signs of weakening in commodities, spending, savings and housing, and even a bit in employment. Collectively, those aspects are weighing on growth.
Slowing growth and labor
Over the past 60 years, both nominal and real GDP growth have trended down. And the recent, above-trend gains in 2021, are expected to fall, especially for real GDP, which is set to reset to 2% or less (the orange dot on Figure 3). The reason output growth is lackluster, and even negative for the first half of 2022, is a function of scant productivity growth and a labor market at or near full employment. In the absence of greater efficiencies or productivity, the country simply cannot produce more goods and services without more workers.
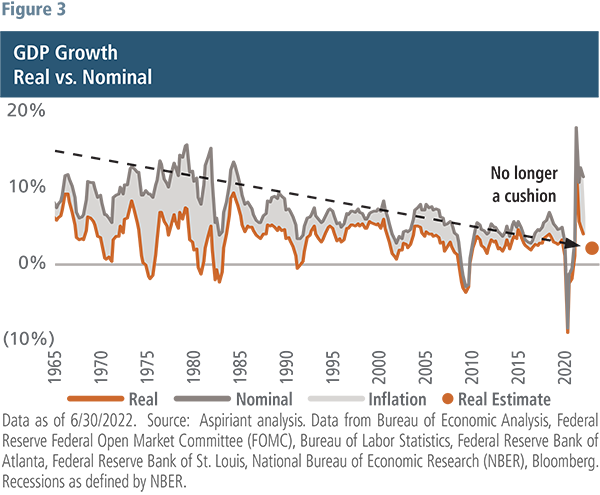
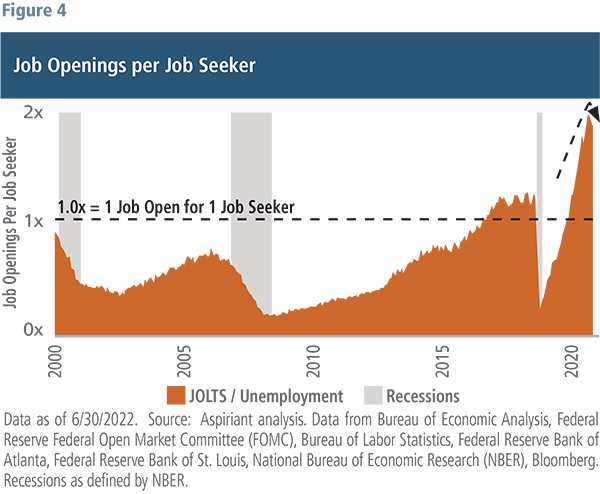
Figure 4 is another way of highlighting tightness in the labor market. The chart displays the ratio of job openings to job seekers. For much of the past 20 years, this ratio was well below 1, meaning there were more people seeking work than available jobs. But as the pandemic hit, the relationship flipped, with more job openings than people looking for work. That anomaly has only grown more severe in the last year or so. Today, there are roughly two job openings per job seeker, well above anything seen in the past. This ratio tends to fall during recessionary periods as available jobs decline and the number of unemployed increases. With the pace of hiring slowing and layoffs moving higher in response to changing economic conditions, we would expect to see this ratio decline in the months ahead and fall more abruptly if we enter a recession.
Income – spending and household savings
Output has really diverged from historical norms and is the main driver behind recently high inflation numbers. Figure 5 measures the year-over-year change in income minus spending. For 30 years, this measure was largely bounded by negative 1% on the low end and plus 4% on the high end. A negative reading means household spending rose faster than household earnings, and a positive measure indicates households earnings increased faster than spending.
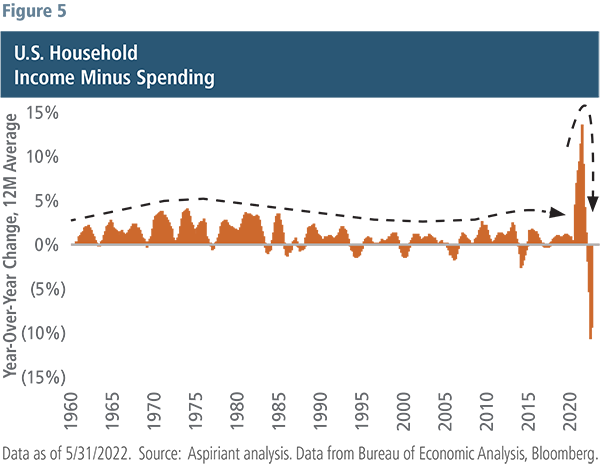
Once the pandemic hit, many people were stranded at home and recipients of generous government relief programs, with the net effect of incomes well exceeding spending. In fact, the year-over-year change in income minus spending reached north of 13% in March 2021. As vaccinations increased and mobility resumed, spending surged, with the once positive change turning to negative 10% in March 2022. That’s why inflation is considerably above the 2% target.
Moreover, the savings rate in February 2020 was 8.3%, according to the Bureau of Economic Analysis. Two months later, it reached an astronomically high level of 33.8%. As economic behaviors normalized, the savings rate fell to 5.4%, as of May 31. The accumulated savings in the aftermath of the pandemic helped fuel spending and absorb the inflationary pressures of the past year.
While accumulated or excess savings are estimated to be around $3 trillion to $3.5 trillion, those numbers mask some underlying risks. Of that excess savings, 70% is concentrated in the top 10% of households. We suspect most of the top 10% of excess savings were realized through participation in capital market activities, such as IPOs, SPACs and company sales, that were ablaze for much of 2020 and 2021. Only 5% of accumulated excess savings are held by the bottom 50% of households, and we expect those reserves will be exhausted sometime soon. So the bottom half of households is especially vulnerable to prolonged inflation pressures and a weakening economy.
Profit margin and capital market expectations
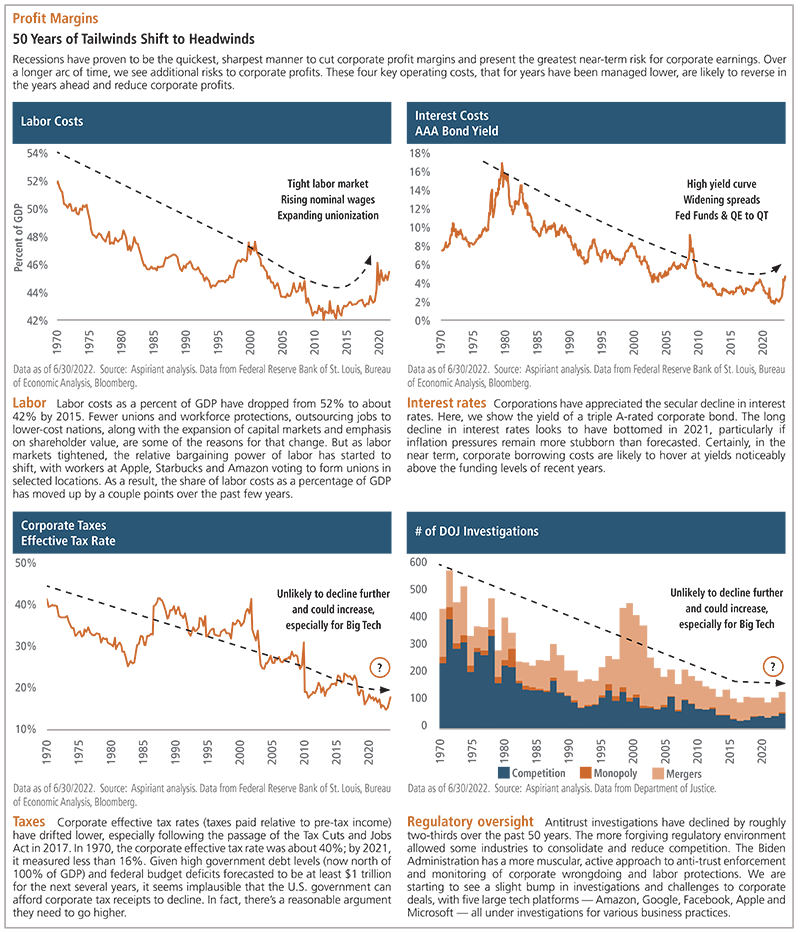
While the risks of a recession grow, that possibility appears absent in corporate profit expectations. In the previous two recessions ─ the Technology, Media and Telecommunications bubble (TMT) and the GFC ─ Wall Street analysts, a notoriously optimistic group, expected corporate profits to move higher in the months before those recessions, only to see actual results dramatically lag those overly ambitious assessments. On average, earnings per share for the S&P 500 dropped about 30% in the prior three recessions.
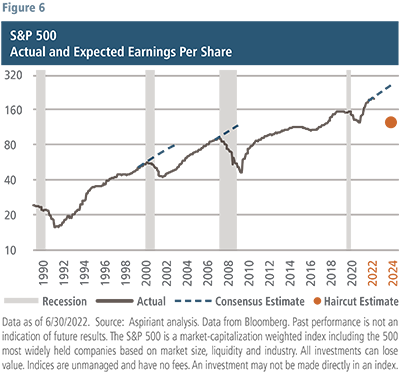
If profit margins were to fall to near their long-term average, S&P 500 earnings per share would decline by 40% over the next two years (Figure 6). These potentially severe outcomes are not priced into U.S. stocks. Instead, analysts expect earnings to grow by 8% to 10% in 2022 and each of the next two years.
Falling asset prices during the first half of the year improved the return outlook, leaving some assets priced to generate a return at or near their fair value expectation. Year to date, the price action in equities is simply a result of future earnings or cash flows being discounted at a higher rate and investors ascribing lower valuation multiples to those metrics. Earning expectations have remained unchanged. For global equities to reach their fair value estimate, they would have to fall by another 30%. The most likely way for that to occur is for earnings to decline. Again, a 30% earnings decline is consistent with the average decline in earnings across the last three recessions. Lastly, for markets to become extremely cheap, similar to February 2009 when global equities offered returns nearly double their fair value estimates, equities would have to fall from current levels by 50%.
Anchor portfolios to withstand volatility
As we move further into the year and the Fed tightening cycle, the trade-offs between lower inflation and higher growth are becoming more pronounced. Despite the initial interest rate hikes, inflation has continued to run well above target. Headline CPI increased 8.5% from the first quarter to 9.1% in June. Excluding food and energy, Core CPI eased some, falling from 6.5% in March to 5.9% in June, but is still well above target.
Looking at both short- and long-term forecasts, investors expect inflation to fall toward the 2% target over the next 12 to 24 months and stay anchored there in subsequent years. While there should be some near-term downward drift in inflation as energy, commodity and supply chain dislocations ease, low unemployment and higher wages, along with low housing inventory and high rents could keep parts of the CPI basket stickier. Housing is one third of overall CPI and 40% of Core CPI. And reconstituted supply chains with a focus on resiliency and national security, along with a weaker dollar, could lead to higher inflation for longer.
As the interest rate hikes take hold, consumption patterns are challenged and spending is likely to fall. The most rate-sensitive sectors of the economy, namely housing and autos, are starting to feel those effects. Mortgage originations, including both purchases and refinances, are off 60% from the peak of activity in 2021. And new auto sales are down 20% in the first half of this year versus the same period in 2021. As businesses begin to respond to shifting economic conditions, unemployment claims have also ticked up and are now back at pre-pandemic levels. At the same time, output or real GDP fell in the first quarter by 1.6% and by 0.9% in the second quarter. Longer term, as the nature of globalization evolves and possibly retreats, those structural changes will negatively affect growth as investment, efficiency and competition recedes.
With these cross currents, the path ahead for the Fed is fraught with challenges. The easy decisions are behind it. Moving away from zero, 1% or even 2% short-term interest rates are straightforward calls when inflation is well above target and the economy is at or near full unemployment. With rates now around 2.50%, the path ahead is less obvious. At some point, the Fed may have to choose one outcome over another.
During the 1970s, the Fed under Arthur Burns repeatedly chose growth and employment over lower inflation, eventually producing persistently high inflation. Paul Volker moved in the opposite direction and prioritized price stability, which ultimately materialized, but only after two recessions and unemployment climbing to 10.8%. What will this Fed do should that conflict arise? Persist with its current plan, pause or pivot to easing? Each has different outcomes and implications for investors.
The expected outcome priced into markets by investors is a so-called soft landing. Inflation eases to around target over the next 12 to 24 months. Economic growth decelerates, but not so dramatically that unemployment moves materially higher and corporate earnings unravel. Markets of course, will fluctuate as expectations around those variables change, and investor appetite for risk-taking oscillates.
While volatility remains on the horizon, we recommend positioning portfolios for both the expected and unexpected:
- Given the wide range of possible paths ahead, we think diversification across geographies and asset classes is especially important today.
- Active management should do well in a period of greater volatility, which we expect will linger through the balance of the year.
- Fundamentals and price have become larger and more central considerations to investors as economic conditions and sentiment have changed.
- Defensive equities, or stocks of companies less sensitive to economic fluctuations or offering essential goods and services, should remain a core holding given their resiliency in recessions and inflationary periods.
- Diversifiers provide portfolio ballast, especially during periods of elevated volatility.
- Real assets provide better relative inflation protection and should have roles in portfolios, especially if inflation runs hotter than expected.
As always, we believe investors should dynamically adjust asset allocations to take advantage of new opportunities as they emerge.
Important Disclosures
Aspiriant is an investment adviser registered with the Securities and Exchange Commission (SEC), which does not suggest a certain level of skill and training. Additional information regarding Aspiriant and its advisory practices can be obtained via the following link: https://aspiriant.com.
Investing in securities involves the risk of a partial or total loss of investment that an investor should be prepared to bear.
Any information provided herein does not constitute investment or tax advice and should not be construed as a promotion of advisory services.
The views and opinion expressed herein are those of Aspiriant’s portfolio management team as of the date of this article and may change at any time without prior notification. Any information provided herein does not constitute investment or tax advice and should not be construed as a promotion of advisory services.
Past performance is no guarantee of future performance. All investments can lose value. Indices are unmanaged and you cannot invest directly in an index. The volatility of any index may be materially different than that of a model. The charts and illustrations shown are for information purposes only. All information contained herein was sourced from independent third-party sources we believe are reliable, but the accuracy of such information is not guaranteed by Aspirant. Any statistical information in this article was obtained from publicly available market data (such as but not limited to data published by Bloomberg Finance L.P. and its affiliates), internal research and regulatory filings.
The S&P 500 is a market-capitalization weighted index that includes the 500 most widely held companies chosen with respect to market size, liquidity and industry.

 Talk to us