
IS&R Highlights
- Strong household balance sheets, increased disposable income, and cheap credit have amplified many Americans’ purchasing power as the pandemic eases, leading to rising stock markets and home values.
- These wealth and income effects have induced greater risk-taking and further gains in asset markets, which can quickly reverse with any economic setback.
- Even with passage of an infrastructure bill and an anticipated social spending framework, we expect less fiscal stimulus over the next few years.
- Expiring government transfer payments combined with wage growth could motivate displaced workers to return to the labor force. However, worker shortages may persist.
- With a tight labor market, rising wages and supply chain bottlenecks, we see inflationary pressures building.
- While long-term inflation expectations closely match pre-pandemic levels, recent price increases have pushed markets to expect asset purchases to begin tapering this quarter and rate hikes to start in the second half of 2022.
- The Federal Reserve’s response to economic and inflation conditions could negatively impact financial markets if not properly calibrated.
- Therefore, we recognize the importance of diversification to increase resiliency to a wide range of possible outcomes and patiently waiting for inviting opportunities.
Examining income and wealth effects
If you think your income will remain strong years from now, you’ll spend more today, feeding a cycle of economic growth that leads to more risk taking.
Related to consumer choice theory and behavioral finance, this concept is known in the investing world as income and wealth effects. Investors need to examine these effects to understand whether the economy, and therefore financial markets, are likely to strengthen or weaken. Properly anticipating the likelihood of those outcomes informs portfolio positioning, allowing investors to be well-prepared in the years ahead. Since these effects are so important, we wanted to explain what they mean and how they relate to today’s economy.
An income effect occurs when a person expects higher disposable income or credit capacity in the future. In that situation, the person is likely to buy more goods and services today and tomorrow. And, since one person’s spending is another person’s income, jobs are created for other people, along with higher wages. Then, those people have more disposable income and access to credit. Therefore, they spend and consume more — perhaps buying a new home, vehicle or washing machine. This creates a spiral from one person to another, driving the economy’s spending power upward.
Note that the availability of credit is subject to banks’ willingness to lend. In general, higher income earners have more access to credit while lower income earners have less access. Accordingly, the “good times” tend to be even better for those at the top of the income chain.
A wealth effect occurs when households have and expect higher net worth, which for many of us consists of stocks, bonds, real estate and cash. As net worth increases, many investors become comfortable taking on more risk. Often, that means investing in assets regardless of how expensive they have become. That’s called “price indiscriminate investing,” which is essentially buying a stock (for example, Tesla) or a cryptocurrency (say, Dogecoin) regardless of how expensive it has become. That behavior can wreak havoc on portfolios during downturns, which is why some investors are wiped out during market selloffs.
It’s not just the wealthy who are willing to take on more risk. Ironically, the people at the other end of the spectrum — those with very little savings — are also prone to making high-risk “investments,” such as buying lottery tickets, meme stocks, short-dated call options and cryptocurrencies. This group of people has a “make-it or break-it” mentality, exhibiting pure speculation in the hopes of hitting it big.
As we’ve experienced, income and wealth effects are typically framed in the context of what happens when income and wealth increase. But it’s also important to consider what happens when they decrease.
Downturns in economic activity and financial markets tend to happen quickly. For example, the Technology, Media and Telecommunications bubble (TMT) and Global Financial Crisis (GFC) each fell apart over the span of about six quarters. And the COVID-19 pandemic clocked the shortest time to crater, at just weeks or months, depending on when you start measuring. So, things can unravel in a hurry. Therefore, it behooves investors to prepare in advance by studying the economy and markets and positioning their portfolios accordingly.
Future income expectations
It’s great to see new COVID-19 cases, hospitalizations and deaths much lower today than in past months, largely related to the global vaccination effort. Looking at some of the data, it’s incredible to see how far we’ve come in less than a year. At the current pace of daily doses, we could very well achieve 75% of the population fully vaccinated — both in the U.S. and globally — during the first half of next year. It’s incredibly sad to consider the many lives lost — nearly 5 million globally and 740,000 in the U.S. But, things could have been a lot worse. So, we always want to pause to express gratitude and thank our medical professionals, essential workers and biotechnologists. Because of their selflessness, life is feeling pretty normal for many of us.
From an economic perspective, gross domestic product (GDP) is running at about $22.7 trillion, which is close to its pre-COVID trendline. It’s interesting to note that for all the headline-grabbing reports on supply chain bottlenecks (semiconductors, resources, ports, truckers and other workers), a more focused view reveals that global demand is the force affecting commerce issues more than global supply.
It’s also worth noting approximately two-thirds of us feel our financial situation hasn’t improved or is even worsening. That observation reflects the widening chasms in income and wealth, which is a global phenomenon. It’s also a primary reason we see socioeconomic differences perpetuating political discord for the foreseeable future.
Turning to the employment picture, which drives the income effect, the labor force is tightening further. We have roughly 5 million fewer workers than before the pandemic, and the unemployment rate is at 4.6%. In addition, year-over-year nominal wages have increased by 5.9%, but that has been offset by year-over-year consumer price increases of 5.4%, which is the highest rate of inflation since the 1990s. So, the big question we’ve been asking is, “Is the rate of inflation likely to be transitory or persistent?”
Future wealth expectations
Looking ahead, we see three main drivers impacting wealth expectations.
The investment landscape looks chock full of risks. We’ve discussed many examples of risk-taking behavior in previous Insights, including record-setting equity valuations, negative (real) bond yields, cryptocurrencies, short-dated call options, over-the-counter (OTC) trades, investments in special purpose acquisition companies (SPACs), and initial public offerings (IPOs) of companies with negative earnings. Needless to say, the investment landscape is littered with landmines. So, one would be wise to hold a portfolio that’s very different than either a traditional or speculative portfolio.
We expect monetary policy to continue being accommodative, both in the U.S. and abroad. Expectations are the Federal Reserve will very slowly begin increasing interest rates in mid-2022, going into 2023 and beyond. However, all bets are off if inflation comes in higher and hotter than expected. If it proves more persistent, the Fed and other central banks could act quickly to contain it by raising interest rates faster than the market expects. That’s because runaway inflation can have undesirable, if not disastrous, effects. Some of the impacts include exacerbated food insecurity, worsening housing affordability, and widening income and wealth gaps. We expect central bankers to strive to avoid those potential outcomes at all costs. So, while there’s not much more central banks can do to stimulate economic activity, they may be forced to raise rates in order to arrest inflation.
From a fiscal perspective, unfortunately the political divides seem to be worsening. Democrats and Republicans are at odds with each other on virtually every aspect of spending and taxation. And, since the Democrats hold razor thin margins in both the House and Senate, they need virtually uniform support within their own party to pass legislation. But finding common ground between progressives and moderates has been challenging for the party’s leadership.
As a result, we expect President Joe Biden’s $3.5 trillion Build Back Better plan to get reduced to something shy of $2 trillion, in addition to the $1.2 trillion infrastructure plan that passed through Congress. Therefore, several initiatives under the plan, including allocations toward environmental protection, child care and college financing are being clipped or cut completely in order to reduce the overall price tag. At the same time, proposals are being considered to find palatable and constitutional ways to increase taxes. Whatever form the final plan takes, it could be the last piece of significant legislation passed before the 2022 midterm elections. At which time, the Republicans could very well take the majority in the House and/or Senate. If that occurs, we wouldn’t expect to see any significant legislation passed in 2023 or 2024. Therefore, the last drops of stimulus may be dripping from the fiscal hose.
Globally, 136 countries representing more than 90% of GDP agreed to a new cross-border corporate tax framework. It establishes a minimum corporate tax of 15% on all companies and will redistribute taxing rights to the countries in which revenue (as opposed to profit) is earned for the largest approximately 100 companies. The Organisation for Economic Co-operation and Development estimates the multi-country agreement will generate up to $150 billion in new tax revenue per year, reallocating some of that amount between jurisdictions.
That would make it the most significant global commerce agreement ever reached, by far. And, it has broad implications for equity investors. So, we’ll continue to closely monitor any new developments.
Income & wealth effects are inextricably related
Figures 1 and 2 illustrate how income and wealth effects are closely linked together, as well as with economic growth. Both charts start in 1960 and end in June of this year.
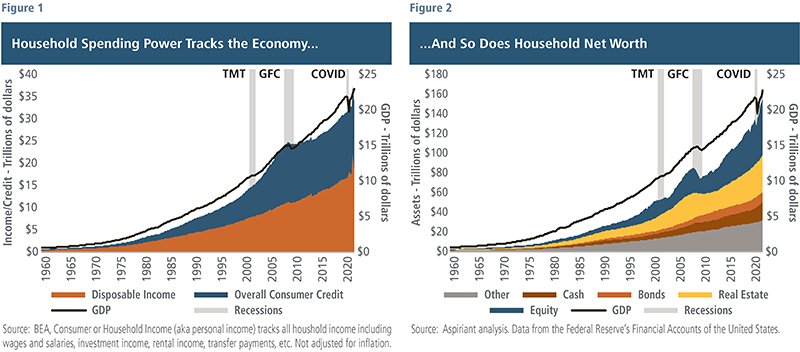
Figure 1 depicts the two largest determinants of spending power: disposable income and consumer credit (including home mortgages). Figure 2 color codes the five largest components of household net worth: equities, real estate, bonds, cash and other components (including private investments).
The vertical, gray shaded areas represent the three periods in which equities sold off significantly. During the TMT, commonly known as the “dot-com implosion,” the S&P 500 sold off by 46%. During the GFC, the S&P sold off by 57%. And, when COVID shutdowns started last March, the market sold off by 34%.
Notice the overall shapes of both charts are remarkably similar. So, as spending power ebbs and flows, so too does household net worth, and each seems closely linked to GDP growth. That makes sense in textbooks as well as the real world. As an economy grows, more and higher-paying jobs are created, and access to credit becomes more readily available. So, spending power increases. Likewise, as an economy grows, profit margins increase and valuations rise, therefore the value of equities and other financial assets increase. As a result, household net worth increases.
Again, these effects tend to flow together. But, they also tend to ebb together. When the markets rolled over, jobs, wages and credit were lost, and thus the value of financial assets, especially equities and real estate fell sharply.
Moreover, when things were flowing, monetary and fiscal policy were generally accommodative, driving GDP, spending power and net worth. Notably, over the past 40 years, inflation was low and steady, and interest rates fell precipitously. But, what happens when the economy runs too hot — squeezing out the most vulnerable among us and forcing policymakers to take action? Where we currently sit, growing pressures could very well result in similar major selloffs.
Demand > supply
The dual effect of the sharp recovery in personal incomes (which grew in 2020 at the fastest pace in 25 years) and rise in household net worth (now siting at an all-time high), has been a surge in consumer spending. Figure 3 shows the change in nominal demand for spending on consumer goods using year-end 2019 as a baseline. You can see demand taking a hit in early 2020 at the start of the pandemic. That fall quickly retraced and then some throughout the rest of 2020 and into 2021. As of September 30, spending on consumer goods is 20% higher than pre-pandemic levels. With more flexible work arrangements, millions of households elected to buy second homes or retrofit existing homes to provide space for dedicated work and study areas, leading to a jump in demand for things like furniture, appliances, building materials and other hard goods.
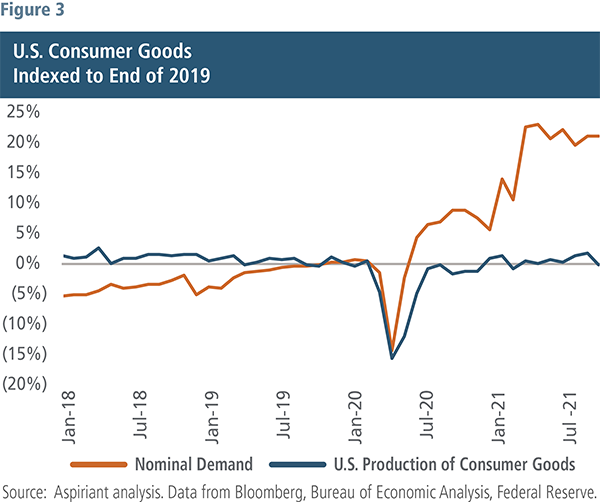
As shown in Figure 3, production or supply has mostly held steady, with production growth hugging the light gray horizontal line at 0%. That has led to a wide imbalance between demand and supply, resulting in a sharp rise in imports, among other consequences, to fill that gap. In fact, the U.S. goods deficit is at record levels, and conversely, Chinese exports have also reached all-time highs.
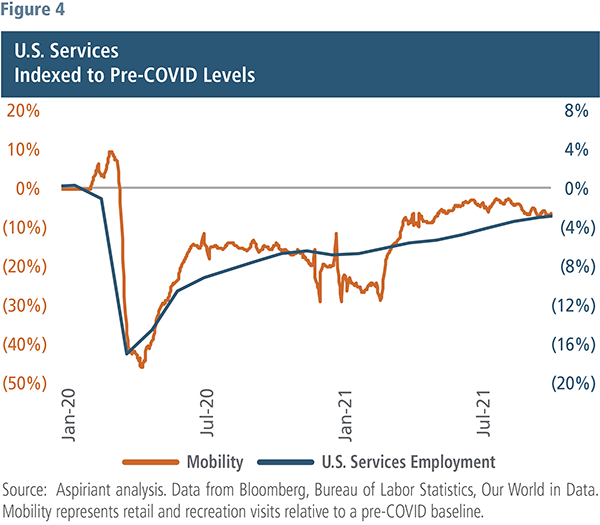
The picture is a bit different for services (Figure 4). The data is not as easy to isolate, so we use proxies or estimates for both service demand (mobility data) and service production (service employment) to gain a picture of the services market. Because services, unlike goods, cannot be stockpiled and mobility (going out to restaurants, sporting events and travel) have all, until recently, been restricted for much of the past year and a half, demand for services is now about 5% off of pre-pandemic levels. Similarly, the capacity of the service industries, as measured by the services labor pool, is down 3% from January 2020, resulting in service markets, with some exceptions, that are in much better alignment between demand and supply.
Walking the inflation tight rope
One by-product of the imbalance between demand and supply, particularly for consumer goods, is the large increase in imported goods. A second consequence is a drift upward in prices due to the shift in demand. Figure 5 shows one widely followed measure of overall price levels, the Consumer Price Index (CPI), over the past 40 years. Since 1980 and through a half-dozen recessions, there has been a gradual lowering of inflation, or disinflation, with CPI moving down from 14% in the early 80’s to roughly 2% to 2.5% for much of the past 25 years. More recently, CPI has climbed higher, hitting 5.4% at the end September.
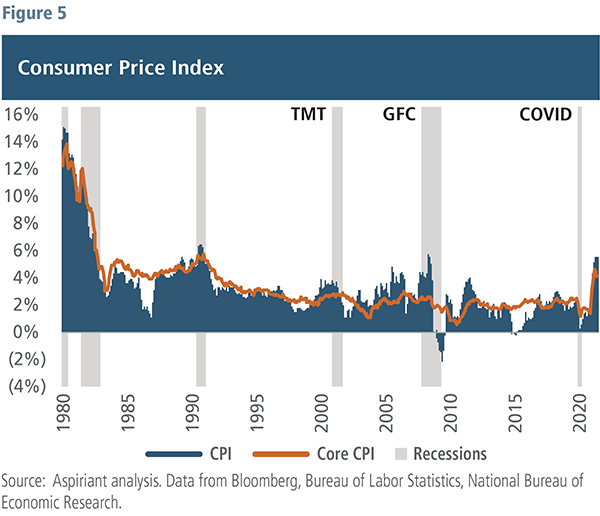
If we remove the more volatile components from CPI — energy (which was up about 25% over the last 12 months) and food (up a bit less than 5%) — and focus on what is known as Core CPI, a metric that also tends to be more widely followed by investors and government officials, that statistic is up 4% over the prior year. Within the Core CPI, the most extreme price movements are in consumer durable goods, not surprisingly, with pricing for services relatively held in check. Exceptions include car rentals and lodging, which are both up double digits over the past year.
The big debate raging among many investors is whether this recent inflation trend is temporary or more permanent. The consensus, or what is discounted in market pricing, suggests that this bout of inflation is more temporary. The difference between nominal and real government bonds of the same maturity is one way to assess that and is referred to as break-even inflation. At quarter-end, break-even inflation, as indicated by 10-year government notes, was roughly 2.4%.
Another method to weigh the outlook for inflation is to survey consumers. Figure 6 shows University of Michigan data on long-term expectations of inflation among consumers. This trend closely mirrors the pattern of the CPI in the prior chart, with a gradual decline since 1990 and a slight uptick following the pandemic. Today, the long-term inflation expectation among surveyed consumers is 3.0%, not terribly different from the 25-year average of 2.8%. The orange dot on the chart shows the next 12-month expectation for inflation and rests at 4.6%. So, both investors and consumers assume that recent inflation and the imbalance between demand and supply will be fleeting, and by extension, assume the rise in demand is an artificial condition or that supply will soon catch up to demand.
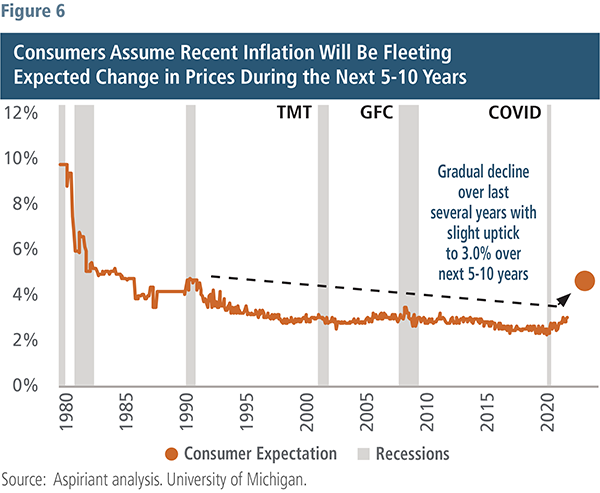
Nevertheless, the worrisome short-term inflation trend against a backdrop of reasonably benign long-term expectations sets up a bit of a tightrope for the Fed to cross.
Disregarding early warning signs and maintaining accommodative policy for longer risks keeping demand ahead of supply, fortifying inflation, destabilizing the dollar and inflaming asset bubbles. On the other end, moving too quickly to withdraw monetary stimulus may imperil the economic recovery and household net worth. The risk of a policy error, in either direction, is much greater today.
Be prepared for unexpected outcomes
The economic outlook is a bit mixed with some currents likely to push growth higher and others likely to weaken the strength of the recovery in the months ahead.
Starting with the pandemic, we think it will continue to subside, especially with the availability of booster shots, child vaccines and eventually anti-viral drugs, which will allow for more normalized movements and activities. Household financial strength is quite positive, with record net worth, strong labor dynamics and employment, and low debt-service burdens, all serving to keep spending aloft.
On the other hand, fiscal stimulus, even with the passage of the infrastructure and reconciliation packages, is likely to recede as emergency conditions have passed and substantive legislation is most probably frozen before and after the mid-term elections.
Inflation is the real wildcard. In the short-term, the mismatch between demand and supply will persist. Longer term, the market seems reasonably complacent inflation will not break much beyond its range over the past 20 to 30 years. Regardless, the uncertainty about long-term inflation sets up a difficult road for the Fed to navigate. As it stands today, the market expects the Fed to begin tapering its asset purchases this quarter and to hike interest rates two times in the second half of 2022.
To weather potentially unexpected outcomes, we suggest investors diversify their risk exposures to bolster their portfolio’s resiliency. To achieve that, we recommend holding a mix of positions across different geographies, asset classes, styles and liquidity profiles (i.e., public and private markets). As part of that formula, we also think investors should consider owning real assets and maintaining exposure to stocks of high-quality companies with the power to pass through cost increases, as both asset classes can provide some protection against higher and prolonged inflation. And as always, we encourage investors to dynamically allocate assets and be open to new opportunities as they emerge.
Important Disclosures
Aspiriant is an investment adviser registered with the Securities and Exchange Commission (SEC), which does not suggest a certain level of skill and training. Additional information regarding Aspiriant and its advisory practices can be obtained via the following link: https://aspiriant.com.
Investing in securities involves the risk of a partial or total loss of investment that an investor should be prepared to bear.
Any information provided herein does not constitute investment or tax advice and should not be construed as a promotion of advisory services.
The views and opinion expressed herein are those of Aspiriant’s portfolio management team as of the date of this article and may change at any time without prior notification. Any information provided herein does not constitute investment or tax advice and should not be construed as a promotion of advisory services.
Past performance is no guarantee of future performance. All investments can lose value. Indices are unmanaged and you cannot invest directly in an index. The volatility of any index may be materially different than that of a model. The charts and illustrations shown are for information purposes only. All information contained herein was sourced from independent third-party sources we believe are reliable, but the accuracy of such information is not guaranteed by Aspirant. Any statistical information in this article was obtained from publicly available market data (such as but not limited to data published by Bloomberg Finance L.P. and its affiliates), internal research and regulatory filings.
The S&P 500 is a market-capitalization weighted index that includes the 500 most widely held companies chosen with respect to market size, liquidity and industry.

 Talk to us


