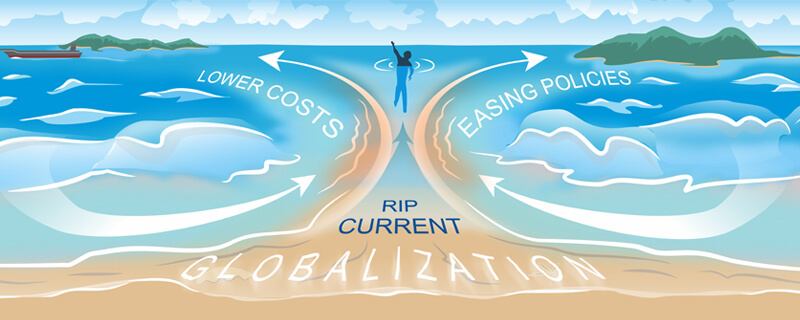
Globalization’s rip current on Big Tech and the markets
We’ve discussed how political change could result in new policies that either marginally bend or completely reshape how the future unfolds. Since policies affect the overall business landscape and asset pricing, skilled investors attempt to understand the circumstances that underpin the current environment and assess the probability of any significant disruption to their durability.
The last several decades have been particularly favorable for corporations and shareholders. Persistently low labor and borrowing costs, as well as easing tax and regulatory burdens, lifted profit margins, valuation multiples and investment returns. To offset many of these effects and redistribute more economic benefits to workers, some politicians have placed a target on large companies, especially mega capitalization technology companies, because they have benefited the most.
The grip of the rip
A rip current is a strong but narrow water flow moving directly away from the safety of shore. Like a powerful river running out into the open ocean, the current cuts through oncoming waves that would otherwise confine it to shallow waters. Until a person is swept up in one and ripped swiftly out to sea, they can be difficult to detect.
A similarly dangerous phenomenon occurs when it comes to investing. Occasionally, a small group of stocks rips ahead of the overall market, even though their cash flow doesn’t justify their lofty valuations. Nevertheless, investors lured by their rapid advance become drawn in, touting these companies as industry leaders and business innovators, which offer products or services that are category killers or disruptive technologies. As the current flows, danger builds for shareholders in these companies, as well as for investors in the broader market.
That’s because the same forces ripping these stocks ahead are common to all stocks, but oftentimes to a lesser degree. Eventually, the conditions creating the rip current change, and the hazard dissipates. Unfortunately, that generally occurs after investors have experienced significant losses.
Ripping conditions
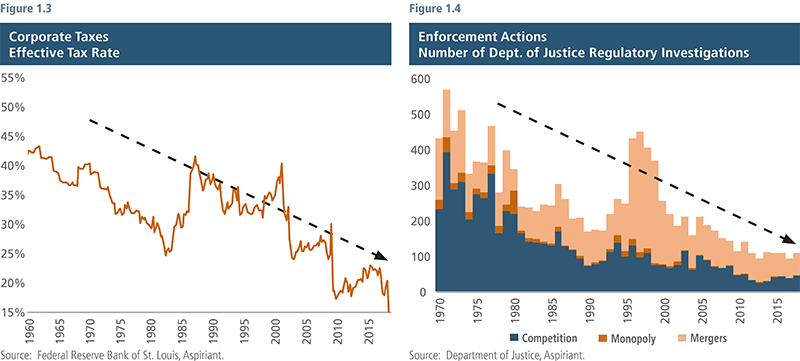
Since the 1960s, equity investors have enjoyed an incredibly pro-business environment. As shown in our charts, some of the principal costs of doing business — including labor costs and borrowing costs, as well as tax rates and business regulation — have steadily decreased.
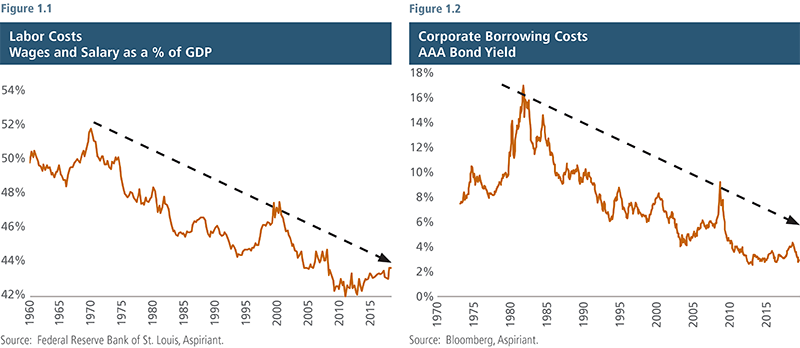
Labor costs (Figure 1.1) have been driven down due to the adoption of new and better technologies, processes, machines and infrastructure. These advances have allowed companies to fully or partially automate routine tasks that were previously carried out by employees. Labor costs have also been subdued as fewer workers operate under collective bargaining agreements. The percentage of workers participating in a labor union has declined from 16% in 1985 to 9% in 2018.
Corporate borrowing costs (Figure 1.2) have also decreased dramatically over the years. Global central banks have increasingly embraced accommodative monetary policy to support growth by lowering prevailing interest rates, with the shift in benchmark rates flowing through to companies and other borrowers. Unlike in prior cycles, central banks have been able to set and keep rates at or near zero because of soft (below target) inflation. Among other factors, global supply chains with lower production costs, aging demographics, high debts, and a widening wealth gap have all curbed inflationary impulses in recent years and allowed central banks greater latitude to meet employment mandates or growth targets.
In addition, corporate income taxes (Figure 1.3) as well as enforcement actions (Figure 1.4) have eased dramatically over the years. These policy shifts have also reduced both the direct and indirect costs of doing business.
The Common Undercurrent
A common factor driving down all business costs has been globalization, which refers to the level of cooperation, trade, investment and migration between countries. Like a powerful undercurrent moving below the water’s surface, globalization cannot be easily detected, but its impacts (especially after many years) can be observed. Like other shifts, the impacts of globalization to society’s stakeholders (consumers, investors and citizens) have varied, providing benefits to some while delivering mixed results to others.
Consumers have benefited, to one degree or another, depending on their consumption patterns. Global competition has had a meaningful effect on the quality and affordability of just about every good and service produced and consumed around the planet. As a result, consumption has gotten better, cheaper and easier over the years.
Investors have benefited as well. Globalization has allowed companies to reduce costs by using cheaper overseas labor or purchasing less expensive supplies. In turn, higher profits have led to higher equity returns. However, not everyone owns financial assets. As a result, today the Top 1% of Americans have as much in household net worth as the bottom 90%,1 indicating that the gains in wealth have been uneven.
The benefits of globalization to lower-income and middle-income classes (i.e. those who consume less and invest modestly) have been harder to measure and less clear.2 As a result, some elected officials who believe a more balanced society is the best long-term answer are actively promoting ways to reorder some of the benefits of globalization.
Corporate profitability: Roll tide
As the overall cost of doing business has fallen, corporate profitability has risen to historical highs (Figure 2). Since profitability increases a company’s ability to generate shareholder wealth (e.g. in the form of cash flow from higher dividends or reinvestment in value-adding projects), stock prices have also been robust in recent years.
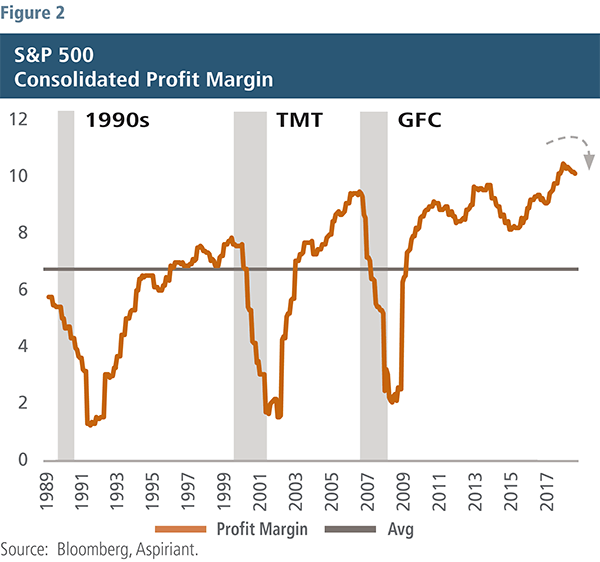
For example, over the seven-year period ending September 30, 2019, the S&P 500 generated a total return of 139% with the underlying companies increasing in value by $12 trillion to a total of $25 trillion today. By our estimates, more than half the gain was due to temporary or unsustainable deviations from fair value estimates of profit margins and multiples, with the remaining related to more durable cash flows (dividends and growth).
The chart clearly highlights the effects of the business cycle. Like rolling waves, business cycles have been predictably certain throughout time although their frequency has varied. A complete market cycle tends to last between seven and 10 years, comprised of five to seven years in which margins expand (the wave crests) followed by two to three years in which margins compress (the wave crashes).
The gray shaded areas highlight the three recessions that occurred during the period: the early-1990s, the Technology Media and Telecommunications (TMT) and the Global Financial Crisis (GFC). Doing so helps illustrate that rollovers tend to occur both swiftly and severely. That’s because circumstances (higher costs of doing business) lead to actions (companies pulling back), which generate responses (consumers spending less). These related dynamics can result in self-reinforcing outcomes, like the end of a business cycle.
Why do business cycles occur? Well, at some point, growth in corporate profitability begins to slow. That doesn’t necessarily mean that profits turn to losses. Rather, it simply means the rate at which profits were increasing begins to plateau. That might occur, for example, if one or more of the costs previously discussed increases rather than decreases. For example, wages and salaries might begin to rise in a tightening labor market as fewer people look for work and companies elect to increase compensation in order to attract, retain and motivate their workforce.
Whatever the catalyst, as growth slows, companies don’t just sit idly by. Rather, they look for opportunities to cut pricing to protect market share or cut costs to protect their bottom lines. Since one company’s spending is another company’s revenue, a drop in spending at one company slashes revenue at another. In turn, that next company reduces its spending, which punctures another company’s revenue and profits. This downward spiral continues, compressing corporate margins along the way until such time that the process reverses (usually triggered by major shifts in monetary and/or fiscal policies).
Big Tech 1.0
Today’s market environment is similar to the build-up and pullback of the early 2000s. At that time, corporate profitability and investment returns across most U.S. companies had been building for years. In fact, as of August 31, 2000, the trailing seven-year annualized return of the S&P 500 index was a staggering 20.8%. In dollar terms, an investment of $1 million would have been worth $3.6 million over the period.
Unfortunately, over the next approximately two years, the business cycle and market cycle rolled over, with investors losing a large portion of the investment gained over the previous seven years, ending with a value of just $2 million as of October 9, 2002.
The most beloved equities were those in the TMT sectors. A subset of those stocks, which we refer to as Big Tech 1.0, included Intel, IBM, Oracle, Cisco, eBay and Microsoft. Since many investors piled into these stocks, they ripped ahead of the overall market, but also crashed with devastating consequences.
The big impact of Big Tech
Figure 3.1 displays the total market capitalization of the S&P 500 since 1995. We have color-coded 11 companies we classify as Big Tech as well as five companies we classify as Mid Tech.3 The chart illustrates a few important points. First, the market capitalization of these companies has become a larger portion of the total investment universe. Second, Big Tech tends to crest higher and crash lower4 than the overall market. Third, their impact on total investment returns has grown over time. For example, in the three years ending September 30, 2019, the Big Tech companies accounted for 33% of the total return of the S&P 500. As a result, investors in the broad market get caught in the current with these whales, whether good or bad.
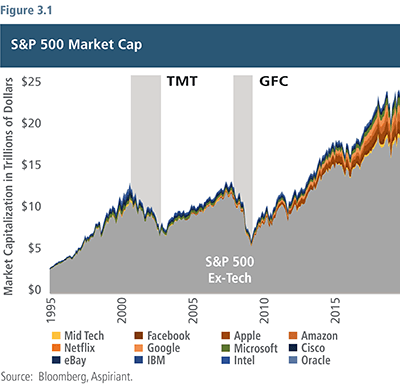
Figure 3.2 eliminates the 484 companies in the broad market, allowing us to focus on the 16 companies we consider Big Tech and Mid Tech. Although these companies represent a small number of the total 500 companies, they have represented a growing portion of the total market capitalization. So, whereas these companies represented approximately 4% or $136 billion in 1995, today they represent a whopping 23% or $5.6 trillion. In addition, the companies appear highly correlated, meaning they tend to ebb and flow together. As a result, they offer little diversification and give rise to amplified outcomes as they advance or decline.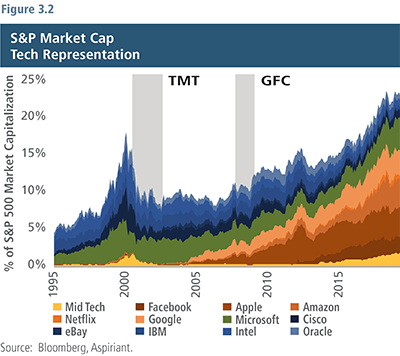
Big Tech’s high and growing margins have led to high and growing valuations. But, the composition of Big Tech can undergo abrupt changes as competition, innovation and consumer priorities shift. Figure 3.3 illustrates the point. In the mid-1990s, a handful of companies shaded in blue colors (Oracle, Intel, IBM, Cisco and eBay) represented approximately 68% of Big Tech’s market capitalization. Today, those same companies only represent 14%. Over the years, they lost their leadership positions with the rise of social media, online advertising, smart phones and consumer services to the companies shaded in orange colors (Facebook, Apple, Amazon, Netflix and Google).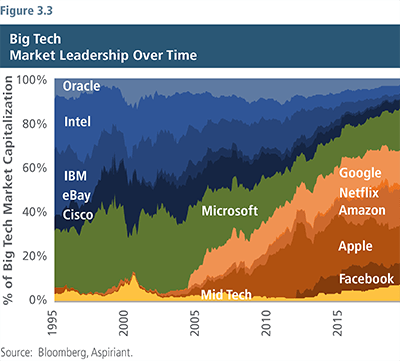
Although each of the companies shaded in blue has survived, they have done so with much more modest expectations and valuations than they exhibited in the past. Whereas their combined market cap was $1.5 trillion in August 2000, today they represent $780 billion — losing a combined $720 billion in value over the past 19 years.
Clearly, competition and new innovations can shake-up industry leadership over time. And, the leaders of today may very well turn out to be the followers of tomorrow. This result makes it very difficult to know in advance which company or companies will win over the long term. Investors would be better-served owning all of them rather than betting on one or two; however, investors would be best-served with Big Tech representing just a sliver of a well-diversified portfolio.
Big Tech Bellwether
An interesting exception to the rise and fall in industry leadership is Microsoft. It has successfully supplemented its core businesses (operating systems and software applications) with growth businesses (gaming, entertainment and cloud services). As a result, it has been able to successfully navigate through pivots in consumer tastes and disruptions from new technologies. Today, Microsoft is roughly tied with Apple as the most valuable company in the S&P 500, with a total market cap over $1 trillion.
Big X on Big Tech
High profits and lofty valuations don’t just breed competition, they also invite interest from elected officials seeking to raise tax revenue in order to launch or expand certain social programs. While lower costs and monetary easing policies have helped all businesses, no sector has benefited more than Big Tech. In fact, as shown in Figure 4.1,5 Big Tech posts the second highest pre-tax profit margin. At the same time, as shown on Figure 4.2, those companies pay the lowest in corporate taxes in relation to earnings.
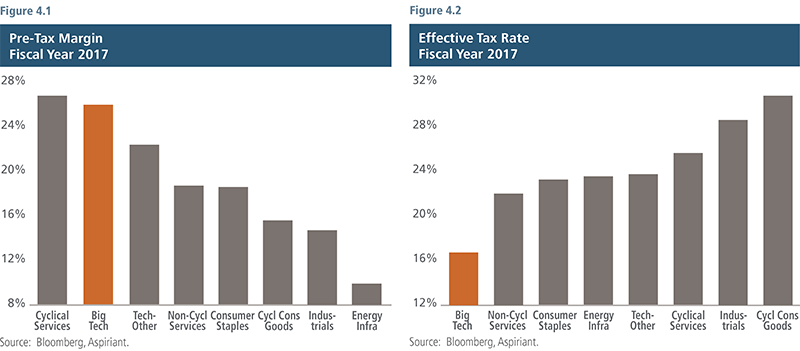
Those figures — along with concerns about privacy, monopolies and election influence — have made them political targets as we enter the 2020 elections. In fact, some proposals currently gaining support by presidential and congressional candidates would dramatically increase taxes on these and other profitable companies. Most notably, proposals are calling for the rollback of the 2017 Tax Cuts and Jobs Act, imposition of a Real Corporate Profits Tax (incremental 7% tax on corporate profits above $100 million) and the addition of new business regulations. Each of those would increase the costs of doing business and squeeze profit margins. Separately, the imposition of a wealth tax and higher income taxes are also being discussed. Each of those measures would tax the people who also happen to be the largest owners of financial assets, including Big Tech stocks. Of course, the probability any of these proposals becomes law is heavily dependent on the outcome of next year’s elections.
Nevertheless, whether driven by competitive threats or by political scrutiny, profitable companies, especially Big Tech, are in the sights of determined foes, which could put pressure on their stock prices and the overall financial markets going forward.
Safety on shore
We’re not expecting a wide-spread or deep economic recession in the months ahead. However, we do believe the risk of a business-led slowdown has increased dramatically over the past several quarters — one that could be triggered by a further deceleration in growth (perhaps due to ongoing trade disputes and uncertain business conditions) or lower profits (related to increasing costs of doing business, including taxation and regulation).
Should a more pronounced slowdown begin to take hold, we would expect some businesses to get out ahead of the pack by cutting costs. Those actions would flow through to other businesses as well as employees (consumers). The cascading effect of these actions would likely detract from economic growth and equity returns over the next several years. Unlike prior cycles, central banks have fewer policy tools available to counteract any sag in aggregate demand, and fiscal initiatives are increasingly compromised by highly partisan and divided governments.
Given these mounting risks, we have allocated our portfolios toward asset classes we expect to perform relatively well regardless of the economic environment. Experience has taught us that the best way to avoid a dangerous rip current is to stay near the safety of shore.
1Source: Federal Reserve (Distributional Financial Accounts), Aspiriant.
2For a broader discussion, see our Second Quarter 2019 Insight, Part III.
3The Mid Tech basket includes Adobe, PayPal, Salesforce, Sun Microsystems and Twitter. Although the impact of these companies on the overall equity market is important, individually, none of the companies is large enough to warrant breaking them out separately.
4Excluding the impact of Google and Facebook during the Global Financial Crisis (GFC) sell-off because each of those companies had been publicly traded for less than three years.
5S&P 500 GIC Sectors associated with the following sectors, unless one of the 16 Big Tech companies previously referenced: Tech and Telecom as Tech – Other, Health Care as Non-Cycl Services; Financials as Cyclical Services; Consumer Discretionary as Cycl Cons Goods; Industrials as Industrials; Consumer Staples as Consumer Staples; Energy, Utilities and Materials as Energy Infra.
Important Disclosures
Aspiriant is an investment adviser registered with the Securities and Exchange Commission (SEC), which does not suggest a certain level of skill and training. Additional information regarding Aspiriant and its advisory practices can be obtained via the following link: https://aspiriant.com.
Investing in securities involves the risk of a partial or total loss of investment that an investor should be prepared to bear.
Any information provided herein does not constitute investment or tax advice and should not be construed as a promotion of advisory services.
The views and opinion expressed herein are those of Aspiriant’s portfolio management team as of the date of this article and may change at any time without prior notification. Any information provided herein does not constitute investment or tax advice and should not be construed as a promotion of advisory services.
Past performance is no guarantee of future performance. All investments can lose value. Indices are unmanaged and you cannot invest directly in an index. The volatility of any index may be materially different than that of a model. The charts and illustrations shown are for information purposes only. All information contained herein was sourced from independent third-party sources we believe are reliable, but the accuracy of such information is not guaranteed by Aspirant. Any statistical information in this article was obtained from publicly available market data (such as but not limited to data published by Bloomberg Finance L.P. and its affiliates), internal research and regulatory filings.
Equities. The S&P 500 is a market-capitalization weighted index that includes the 500 most widely held companies chosen with respect to market size, liquidity and industry.
Fixed Income. The Barclays U.S. Aggregate Index represents securities that are SEC-registered, taxable and dollar denominated. The index covers the U.S. investment grade fixed rate bond market, with index components for government and corporate securities, mortgage pass-through securities and asset-backed securities. These major sectors are subdivided into more specific indices that are calculated and reported on a regular basis.

 Talk to us


