
The downward trend of the market over the last year and the recent recovery has people wondering if the worst is behind us. It is a complicated environment with the Fed defending a hawkish stance while the market is concerned with signs of slowing growth. The current inverted yield curve, where 3-month Treasury yields are higher than 10-year Treasury yields, has been a great predictor of recessions. Historically, the equity market hasn’t hit bottom until the economy is in recession and the Fed has lowered short-term rates. But many bear markets provide us hope midway through the agony with brief recoveries just for the market to falter again. We have seen a couple over the last year. Only time will tell if the current recovery falls victim to the same fate.
Bear market rallies are periods in which financial assets (recently the S&P 500 Index) temporarily rebound during a severe and longer-term pullback. Oftentimes, investors look at pullbacks as opportunities to “buy on the dip.” We would too if we thought doing so would improve portfolio returns.
However, while bear market rallies of 10% to 20% are common, they are often temporary. During cyclical pullbacks, we’re more apt to consider “selling on the bounce” when bear market rallies occur, expecting the market will resume its downward trend in short order.
Four historical bear market rallies
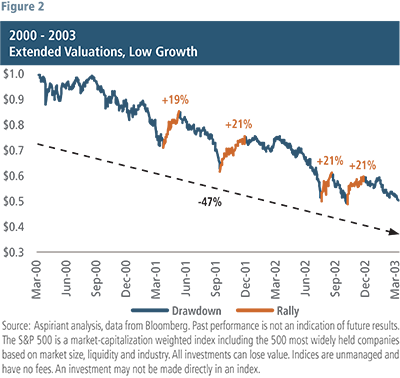
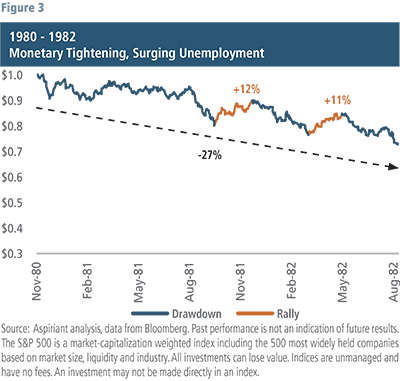
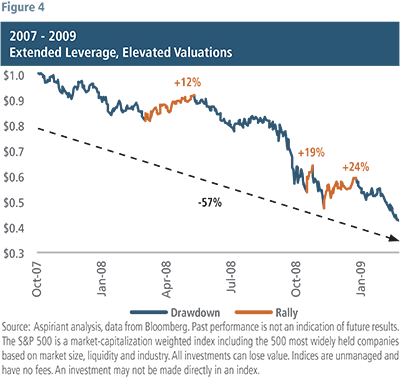
Pullbacks are never straight lines, leading to self-doubt and second guessing for many investors. Figures 1 through 4 illustrate four different periods during which the S&P 500 experienced significant drawdowns. Each period was characterized by different, but very powerful, economic and market forces.
The dashed lines on each chart indicate the total, aggregate drawdown for each period. The orange portions of the jagged lines are the points in time when the index experienced brief, but meaningful, relief rallies.
Notice that the peaks of the bear market rallies generally do not reclaim the previous peak set by the blue lines. And the troughs of the orange lines are typically lower than the previous trough of the blue lines. As a result, each of the lines across the four periods looks like a downward staircase over time.
Figure 1 was the roughly 21-month period between January 1973 through October 1974 known as the 1970’s Energy Crisis. At that time, an oil embargo caused oil prices to spike as consumers were forced to ration. Inflation was rampant and unemployment was on the rise. It was a truly awful period and the one many economists compare to the current environment. As shown, stocks lost nearly half their value during the period, and any investors who bought on the three dips would have ended up seeing lower values in the months ahead.
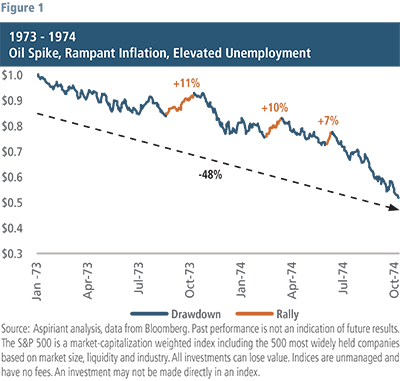
Figure 2 was the period between March 2000 and March 2003, which we refer to as the Technology, Media and Telecommunications (TMT) implosion and is more commonly known as the dotcom bust. But clearly, since this is the S&P 500 Index, the pain was not contained to a handful of negative-earning internet startups listed on the Nasdaq. It was much broader. Similar to our previous example, investors lost nearly half of their money over the period. But notice the four relief rallies along the way, each of which was a temporary bounce of roughly 20%. Many investors were second guessing their analysis at that time. But with each bounce came a subsequent and lower dip.
Spotlight
Zooming in on the Nasdaq Composite (heavily weighted toward more expensive technology companies) we observe the decline year-to-date in the context of previous market selloffs. We think this decline shares similarities to that of the TMT (gray colored line) with lofty valuations as it headed into the market decline. However, unlike the early 2000s period, the market also faces additional headwinds with rising interest rates and what we expect to be a less liquid market environment moving forward.
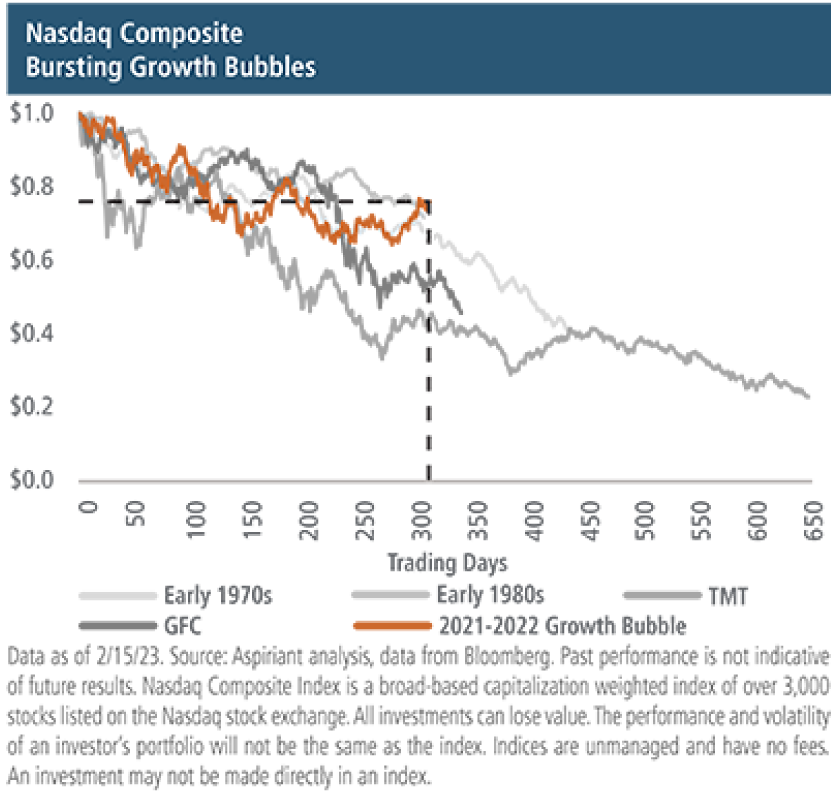
Figure 3 reflects the recession and corresponding pullback in the early-1980s. And Figure 4 captures the Global Financial Crisis. Again, while the forces at play in each environment differ, they all collided with devasting impact on broad-based stocks and other risk assets.
What’s this rally looking like?
So, let’s take a look at how the current bear market is shaping up on Figure 5. Since the present environment hasn’t fully played out, the chart presents a hypothetical example of what could happen. The future is quite uncertain and, therefore, overcommitting to any one point of view or strategy exudes an inappropriate level of confidence. We try to always act with humility and never hubris. So, we think about the future as a range of potential outcomes, with some more likely to occur than others.
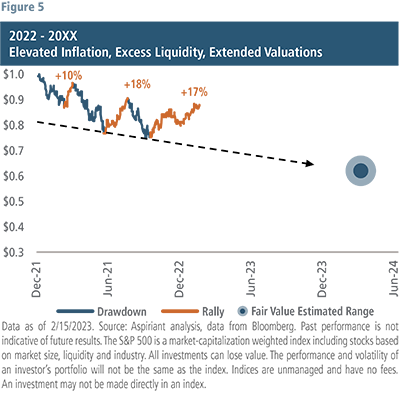
Nevertheless, this hypothetical example allows us to make a few salient points. One year ago, our math indicated that the S&P 500 was about 40% overvalued. In other words, it would have had to drop by approximately 40% in order to produce a forecasted return of 7% annualized, which we consider Fair Value based on our Capital Market Expectations framework. That’s precisely why we’ve limited client exposure to passive, market-cap weighted stock funds and instead constructed portfolios that are quite different (emphasizing active management across value, defensive, international and emerging equities).
Our example assumes it would take roughly 2.5 years to experience the full pullback. And, as of February 15th, the S&P 500 returned -11% since the end of 2021. So, at this point, it is fair to say we would not be surprised to revisit the lows of October. In addition, the S&P 500 has already experienced three bear market bounces, but again, thus far they have been fairly routine in comparison to the four examples above.
Where do we go from here?
It is important to continue focusing on the long-term and remain diversified. As we highlight often and Howard Marks, investment legend from Oaktree Capital Management, spoke of in his recent memo titled “Sea Change” interest rates are extremely important to investment returns. Even with all the positive changes to technology and globalization over the last 40 years he said, “I’d be surprised if 40 years of declining interest rates didn’t play the greatest role of all.” Interest rates dropping from 17% in 1981 to under 1% in 2021 increased the value of all assets including the stock market. Unfortunately, that level of interest rate change is not going to happen from here.
The recent rally has people more optimistic about the future. They could be right. As Marks points out in his memo, the investors who believe the worst is behind us believe (a) inflation returns to sub-2%, (b) interest rates return to ultra-low levels, and (c) a recession will be averted or mild with little impact on corporate earnings. History suggests this is an unlikely outcome.
We have not yet been tempted to buy on these recent bear market dips because math, experience and history all indicate that cheaper opportunities, particularly with U.S. large cap growth companies, may very well lie ahead for those disciplined enough to wait. We remain vigilant and look for the best risk-adjusted returns the market will provide.

 Talk to us


