IS&R Highlights
- The story for 2023 will shift from inflation and center on economic growth and its corresponding impacts on corporate profits and unemployment.
- This tightening cycle is the most aggressive one in decades, and tightening cycles almost always precede recessions.
- Consumers, especially lower income households, have been affected by inflation and that will likely have more visible economic consequences over the course of the year.
- Decreasing wealth can lead to price indiscriminate selling, creating attractive investment opportunities for those who recognize and take advantage of bargains.
- We expect higher volatility and less uniform financial asset performance as passive, market-cap weighted portfolios struggle.
- Renewed focus on fundamentals gives asset allocators and active managers that pay attention to valuations an opportunity to outperform.
New Year, New Era
Headlines celebrate the fact inflation has been cooling in recent months, fueling investor optimism and encouraging a return to irrational risk taking. That would be great news if inflation were an input to the economy and markets. But it is not. Inflation is a consequence of actions. Like the speedometer of a car, pushing the accelerator makes the needle go up; while depressing the brake makes the needle go down. Same with policy actions and the resultant effect on inflation. It should be no wonder inflation has been falling given waning fiscal stimulus combined with severe monetary tightening currently underway. It is a sign that restrictive policies are working by slowing growth and spending.
After the magnitude of declines experienced in 2022, the future looks better, especially for valuation-driven investors (i.e. those who pay attention to the price they are buying and selling at) due to i) higher cash rates, ii) lower asset prices and iii) cooling inflation. But it is important to recognize that speculation is still present in broad-based asset valuations, because thus far, price decreases largely reflect higher interest rates and not decreasing growth or falling earnings. Keep an eye out for an upcoming Market Perspective on our Capital Market Expectations or CMEs, which show higher forecasted returns and how portfolios can improve risk/reward characteristics going forward.
The Federal Funds rate hikes, from roughly 0% to 4.5%, over the past year represent the highest and fastest increases in forty years. Two observations throughout history are noteworthy:
- First, there has never been a tightening half as restrictive as the current one that did not lead to a recession.
- Second, the yield on the 10-year Treasury minus the yield on the 3-month Treasury has only been negative eight times in history. And a recession occurred in all eight instances. Moreover, a recession has never occurred unless this condition has held. As we write this piece today, we’re in negative territory based on the current yields.
This indicates we are likely headed toward, at-best, low growth and at-worst, a severe recession. At the same time, the Fed’s move from quantitative easing to quantitative tightening is sapping financial liquidity. From the highest level, we see one of two economic scenarios playing out, but we acknowledge that other less likely events could unfold. The two scenarios are: 1) economic growth, corporate profits and employment begin deteriorating or 2) they all remain strong.
In scenario 1, if they begin deteriorating, inflation will likely continue falling, but perhaps remain somewhat above the Fed’s target of 2% given a host of cyclical conditions serving to buoy inflation. In this case, equities, especially U.S. large cap stocks and global growth stocks, could fall by another ~20-25%. This is the amount they must fall to simply return to their long-term averages, which is called “fair value.” In scenario 2, on the other hand, if growth, profits, and employment all remain strong, inflation will likely remain well above the Fed’s target of 2%. And, in that case, the Fed will hold rates higher for longer until they eventually get what they want: a slowdown.
From an investment landscape perspective, valuation-driven portfolios outperformed in 2022 and we believe they could continue doing so over the next several years. We also expect passive, market-cap weighted portfolios to struggle, especially as the Fed shifts between prioritizing full employment and stable prices, the two prongs of its dual mandate.
In either economic scenario noted above – we expect inflation to fall – but markets could nevertheless experience another down leg, so investors would be wise to be prepared— as both risks and opportunities present themselves. It is also worth noting that, longer term, the tailwinds to corporate margins will likely become headwinds in the years ahead. By that we mean decreasing labor costs, low borrowing costs, less regulation and falling corporate taxes may all reverse course – squeezing business prospects and profit margins. Given this set of conditions, we believe rigorous analysis of growth, margins and valuations is the key to success going forward. So, we are confident our fundamental, systematic, flexible yet diversified approach should enable us to navigate the environment.
Shocker! Inflation is Falling
Inflation has been the dominant issue over the last 18 months, but we expect it to take a back seat to growth in the year ahead.
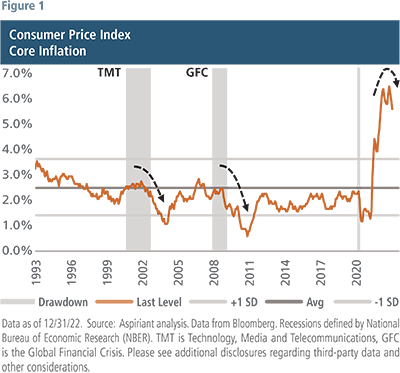 As Figure 1 shows, inflation jumped to multi-decade highs. The Consumer Price Index or core CPI, which excludes food and energy, peaked at 6.6% in September of last year and now sits at 5.7% on a year over year basis, well above its thirty-year average of 2.5%.
The initial driver to surging inflation was related to disruptions from COVID shutdowns and supply chain dislocations. More recently, as those displacements normalized, shelter or rent and other service categories kept inflation suspended above its long-term average.
Rents have a lagged effect on core CPI and should have a much less pronounced impact on inflation going forward as rent growth for new leases falls to low single digits, well off the ten percent plus increases of the last two years. So that leaves non-shelter services, which are heavily impacted by wages, as the last piece of inflation to roll over. The Fed is particularly focused on that component of inflation. While non-shelter services make up about 35% of core CPI, they account for 55% of the core Personal Consumption Expenditures Index, the Fed’s preferred measure of inflation.
As a reminder, the Fed typically doesn’t stop raising interest rates until the Fed Funds Rate exceeds CPI. Financial markets don’t usually bottom until a recession is underway and the Fed is well along in cutting interest rates. Along the way, we expect to see attractive buying opportunities. So, we are not trying to time a market bottom. Instead, we plan to intentionally add risk, as opportunities present themselves.
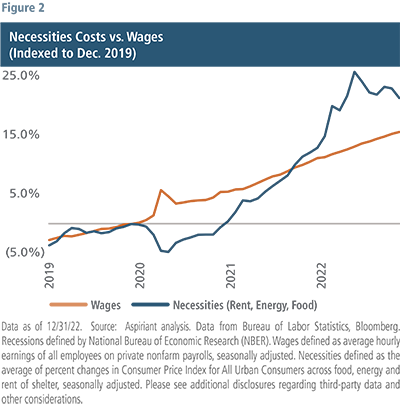 Among inflation’s principal distortions is the loss of purchasing power by consumers. As Figure 2 shows, wages are failing to keep pace with the cost of necessities (shelter, energy, food). In aggregate, the gap has widened to approximately 6%. When this occurs, consumers must make tough choices: they can consume less, reduce the portion of their paycheck they normally save, drawdown accumulated savings, borrow more, or tap into their home equity. Since late 2021, consumers, especially lower income households, have been affected by inflation and that will have more visible economic consequences over the course of the year.
Fed’s Restrictive Monetary Policy
This tightening cycle is the most aggressive one in decades, and even more so if you layer in the effects of quantitative tightening, or QT, which involves the Fed reducing its balance sheet of securities by $95 billion dollars per month. Some economists estimate that QT adds another two points of tightening.
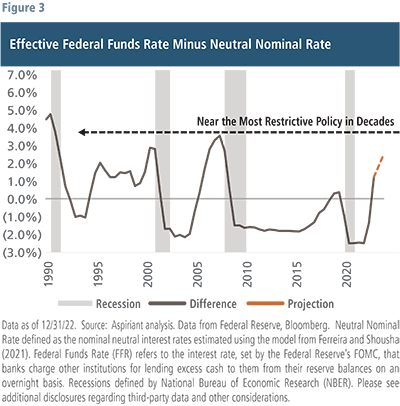 Tightening cycles almost always precede recessions, as seen in Figure 3. So, while investors will continue to wrestle with how high does the Fed go and how long do they stay at that peak rate, the more relevant question, given the tightening to date, is how likely is a recession in the next 12 months? The NY Fed, as one reference point, puts the probability at around 50%.
With the risks of an economic slowdown or contraction undeniably higher now than at the start of 2022, consumers’ ability to withstand sustained higher inflation, and even worse, job loss has also deteriorated. Figure 4 shows growth in the money supply or M2, which includes cash, checking deposits, savings accounts of less than one hundred thousand dollars, certificates of deposit and retail money market funds.
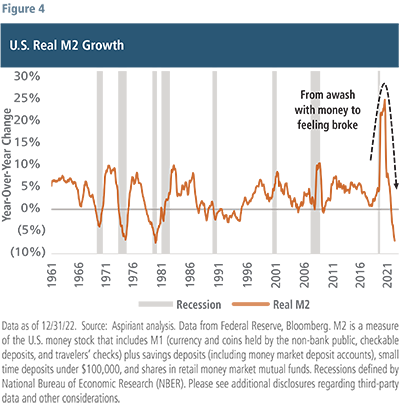 With COVID relief aid and government transfers, M2 grew by approximately 25% in 2021. Today, that same pool of money is shrinking by 7% or 8% on an annual basis. In fact, of the two to three trillion dollars of excess savings consumers amassed during the pandemic, about half is depleted, with the balance, as reported by J.P. Morgan, exhausted by summer of this year. And while M2’s movements are more severe than prior cycles, usually when you get wide swings, growth turning to contraction, a recession follows or is already underway.
Consumer Credit Use Rising, Despite Higher Rates
Over the past 20 years, average credit card rates were range-bound between 12% and 14%. Recently, they spiked to 19%, the highest level since the 1980’s. And, despite interest rates increasing, credit card usage is on the rise. Outstanding balances recently increased to over $1.1 trillion, with the $1 trillion level only touched on two other occasions that turned out to be awful: the GFC and COVID.
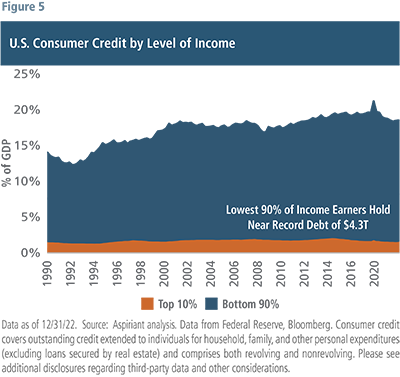 Figure 5 amplifies our growing concerns related to the use of Consumer Credit throughout the U.S. economy, including credit cards, auto loans, and personal loans. Since 1990, the top 10% of income earners have consistently kept low and stable consumer credit balances. However, the lower 90% have slowly, but steadily increased their use of Consumer Credit over time, which now stands at a record-setting ~$4.3 trillion. In a low interest rate environment, most of these borrowers were able to juggle their finances and avoid delinquent payments (with the notable exception of the Global Financial Crisis). In today’s environment, higher balances combined with higher interest rates could soon make lower income cohorts more vulnerable. And, since consumption represents about 70% of GDP, impaired purchasing power for 90% of our fellow Americans could very well limit spending and reduce economic growth.
Household Wealth Drawdown Effects
We already experienced a significant pullback in Household Net Worth during 2022. Household Net Worth tumbled $14 trillion last year, with the Top 1% losing the most – $7 trillion, the Next 9% losing $5 trillion and the Bottom 90% losing $2 trillion. Importantly, changes in wealth do not just affect wealth in and of itself. Decreasing wealth constrains spending, which leads to lower incomes and therefore less spending, growth, and profits as well as lower employment and inflation.
Changes in wealth also affect proclivity for investing and speculating. Decreasing wealth can produce price indiscriminate selling in down-markets. When it spreads and spirals, that behavior wreaks havoc on financial markets. At the same time, it creates attractive investment opportunities for those who recognize and take advantage of bargains.
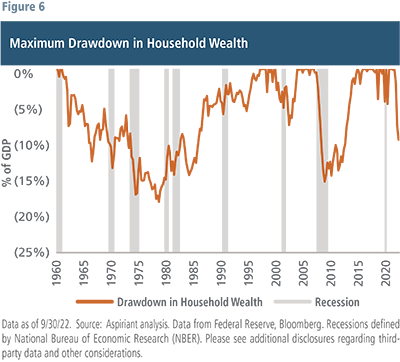 To put the current drawdown in Household Net Worth into historical context, Figure 6 shows the drawdown as a percentage of GDP going back to 1960. When household wealth dropped by >5% one of two things happened: either 1) a series of recessions ensued (like the 1970s and early 1980s) or both a recession and selloff occurred (like the early 1990s, TMT, GFC, COVID). As painful as 2022 was, the pain has been worse in the past. And, although the wealth drawdown of 2022 has somewhat recovered this year, we suspect we have not seen the bottom, yet.
Business Confidence & Spending
Consumer spending accounts for two-thirds of economic activity. Business investment represents about 15% of GDP and is like the contribution from government activities. And CEO confidence in the economy influences businesses’ desire to invest or spend on new projects and facilities, to undertake mergers and acquisitions and hire new employees. So, it is worth monitoring to help assess forward changes in that segment of GDP.
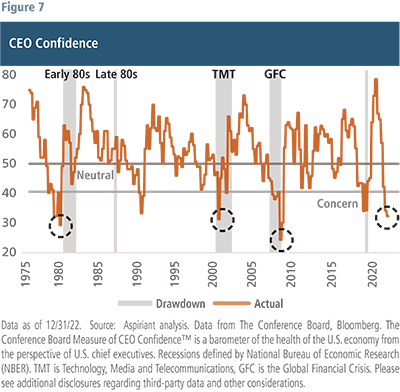 The Conference Board, a global, non-profit research organization, publishes a quarterly survey of 140 CEOs, measuring their perceptions of current and expected business and industry conditions. A reading of fifty is neutral or the outlook is neither strong nor weak, and a measure below 40 usually indicates a recession is imminent or in progress. The most recent CEO survey, at 32, is at its lowest reading since the Global Financial Crisis, when it bottomed at 24. Of note, apart from the latest survey score, 98% of CEOs said they are preparing for U.S. recession over the next 12 to 18 months.
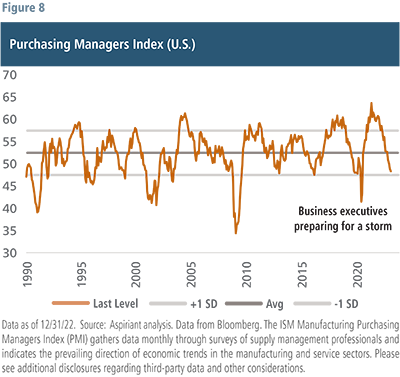 While the outlook for executive confidence and business spending is daunting, the current level of business activity already looks worrisome, as shown in Figure 8. The Purchaser Managers Index or PMI canvasses supply chain professionals at four hundred companies monthly. The score is a composite of new orders, inventory, production, and other measures. Like the CEO survey, a reading of 50 is neutral, a level above 50 implies the economy is expanding and a score below 50 is a sign of contraction. The most recent PMI is just under 48 and in contraction territory. Equally relevant is the change in the PMI. The PMI peaked at 63 in March of 2021 and has fallen steadily since, illustrating the dramatic weakening of economic momentum.
Earnings Recession & Washington Dysfunction
 Despite numerous warning signs of a recession: low CEO confidence, weak PMI scores, an inverted yield curve, or the Conference Board’s Leading Economic Indicators declining for nine consecutive months, investors and Wall Street analysts remain optimistic about corporate earnings.
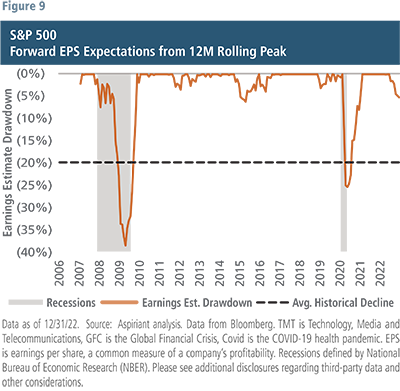
Figure 9 shows the decline in forward earnings estimates from their peak levels over the prior twelve months, or a drawdown chart for corporate earnings expectations. Over the past twelve months, the peak one-year forward outlook for S&P 500 earnings was $235 per share. As of December, the outlook had dropped to $223 per share or a decline of about 5%. Some deterioration, but not much and not anything that reflects recession.
Recessions usually cut earnings by 20% or so, on average. Applying a 20% reduction to the peak earnings outlook, not actual earnings, puts S&P earnings expectations at $190 dollars per share. Capitalizing those earnings at a 16x P/E multiple places fair value at 3000 or 25% lower than today’s current level.
If a recession does occur, and we think that is a reasonable probability, downside risk to equity markets is significant and investors should not dismiss that possibility. Like all scenarios, there are wildcards that could come into play and upend outcomes on both sides. The Fed could adjust course and cut rates sooner and more aggressively. The war in Ukraine could either escalate or reach a negotiated settlement. Another unknown, unfortunately, is raising the debt ceiling.
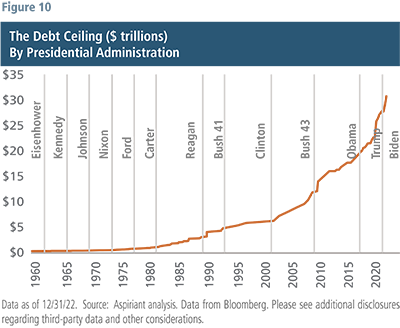
Congress votes for appropriations but needs a separate vote to raise the debt ceiling to fund previously authorized spending. U.S. government debt, as shown in Figure 10, has risen steadily under both Democratic and Republican administrations. But raising the debt ceiling, from time to time, becomes quite contentious.
 In 2011, like today, Republicans demanded spending cuts as a concession to raise the debt ceiling. The 2011 crisis was resolved but not before the delay caused the first downgrade of the U.S. credit rating. It is hard to know if the debt ceiling will be resolved smoothly in the next six months. We are already at the legal limit and using extraordinary measures to avoid default. It took fifteen votes to elect a House speaker, and that has not happened in over 150 years. So, we cannot rule out anything and investors are well served to hold portfolios resilient to a wide range of outcomes: monetary, fiscal, economic, geopolitical, and otherwise.
Market Outlook & Opportunities to Outperform
The story for 2023 will shift from inflation and center on economic growth and its corresponding impacts on corporate profits and unemployment. And should growth falter, as anticipated, we expect the Fed to be less reactive to it, unlike their responses in prior cycles. There are reasons for that. First, inflation is still high and above the Fed’s target of 2%. Second, despite near-term cyclical disinflation trends, longer-term inflationary pressures remain, such as restructuring of global supply chains to prioritize resiliency over efficiency, an ongoing housing shortage, and anemic labor supply growth. Finally, the Fed has repeatedly cited the policy failures of the 1970s in its public comments and it hopes to avoid the stop and start episodes of defeating inflation from that period. At the same time, fiscal policy will likely become less supportive to economic conditions given acute political differences, divided government, and Republicans, especially House members, intent to reducing spending. So, risks are still present. They simply changed, shifting from inflation and interest rates to economic growth and corporate earnings. And in doing so, so too will the opportunity set for financial assets.
With that backdrop, we expect to see higher volatility and less uniform financial asset performance in the future. Our CMEs suggest a traditional global balanced (60% equities, 40% fixed income) portfolio will struggle to keep pace with inflation in the years ahead. That expectation is not due to the death of the 60/40 or portfolio diversification as speculated in the financial press. Quite the opposite, diversification has never been more important and fixed income could do relatively well if a recession occurs. In our opinion, the 60/40 portfolio will falter because of its passive approach and high exposures to the most expensive parts of global markets (U.S. stocks and growth stocks in particular). We started to see investors prioritize cash flow versus growth at all costs last year, and we think that carries over into this year.
Renewed focus on fundamentals gives asset allocators and active managers who pay attention to valuation an opportunity to outperform. To that end, we recommend overweighting value and international equities. Fixed income, as previously mentioned, should perform much better going forward and re-assert its stabilizing role in a portfolio, especially if a recession ensues. Similarly, diversifiers (investments that tend to have less market and/or interest rate risk) should provide further portfolio ballast amid swirling macroeconomic risks. Defensive equities (companies with low debt and more resilient business models) should better withstand volatility and allow investors to hold risky assets more comfortably. And for clients with both the willingness and ability to forego liquidity, we also suggest looking for differentiated strategies in private markets to take advantage of dislocations and/or long-term secular trends.

 Talk to us


