In “Mastering the Market Cycle: Getting the odds on your side,” famed economist Howard Marks explains that in business and market cycles, most upside excesses and downside overreactions are the result of exaggerated swings in investor psychology. “Thus, understanding and being alert to excessive swings is an entry-level requirement for avoiding harm from cyclical extremes, and hopefully for profiting from them.”
History has demonstrated that both financial markets and real economies move in cycles through various points in time. The former is commonly known as a “market cycle,” and the latter is called a “business cycle.” Currently, we are in the 11th year of an expansion in the business cycle as well as a rally (or bull market) in the market cycle. But what exactly are business cycles and market cycles? How are they different, how do they relate to each other, and what are the mechanisms that drive them?
Business cycles — our economy
A business cycle is the natural fluctuation in economic activity as represented by the total output of an economy, which we refer to as Gross Domestic Product (GDP). Generally, there are four phases to each business cycle: expansion, peak, recession and trough. When the total output of an economy declines (recession) and ultimately bottoms (trough), we then enter the next cycle’s expansion phase.
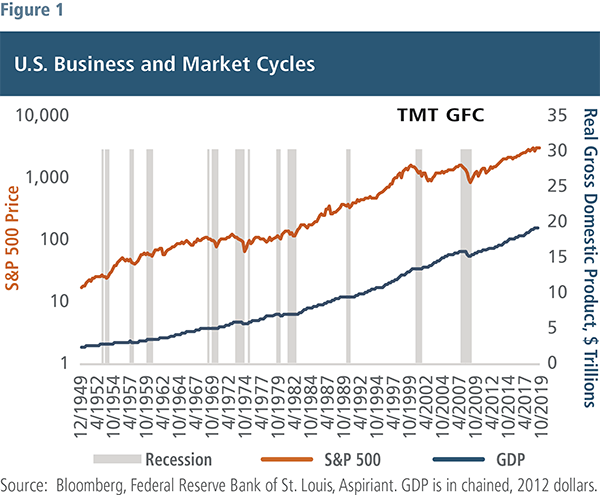
A recession is normally defined as two consecutive quarters of negative GDP growth, also known as a contracting economy. Figure 1 shows the last 11 recessions in the United States (see shaded bars). We can clearly see that while the length of the expansions and contractions vary, since 1950, the average length of the entire business cycle has been roughly six years, comprising five years for the average expansion and roughly one year for the average contraction.*

Since 1970, the average business cycle has lengthened to about seven years as inflation has become less of a problem and policymakers have gradually improved their skillsets at managing the economy and reducing the frequency of recessions. Additionally, the U.S. economy has become more service-oriented, so it’s less susceptible to booms and busts. We are currently in month 126 of the expansion phase and corresponding bull market, the longest on record.
We know that the current expansion phase will come to an end at some point, but it’s hard to know exactly when. We can, however, study history to better understand some of the patterns that occur leading up to a recession, and thus the end of a business cycle.
Typically, we see similar economic characteristics and data points that signal a recession in the near term. We call these “leading economic indicators.” Today, there are several leading indicators that would suggest the likelihood of a recession might be somewhat elevated. Among those are falling long-term interest rates. Typically, when the long-term interest rate approaches the short-term interest rate, it tends to suggest that market participants (investors) are signaling declining growth in the future and lower inflation. It may also suggest that the demand for long-term business borrowing and investment is declining.
The market cycle — our investments
While the business cycle is driven largely by fluctuations in macroeconomic fundamentals — such as unemployment, inflation or interest rates — the market cycle represents the fluctuation of stock prices over time. Market fluctuations tend to be more pronounced as they are further influenced by changes in investor psychology and behavior.
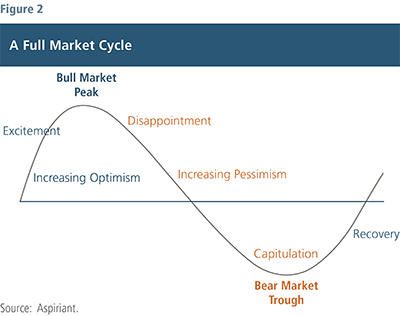
Similar to business cycles, market cycles have distinct phases that vary in length and are composed of an expansion, a peak, a contraction, and a trough or bottom. The beginning of the expansion tends to coincide with increasing investor optimism that the economy is growing, which is followed by excitement as stock prices rise, leading up to the peak. As the market crests and prices start to decline, we tend to see disappointment and increasing pessimism, followed by a sell-off (capitulation), marking the trough.
In Figure 1 above, the market cycle, represented by the S&P 500 stock index, is superimposed with the business cycle (GDP). They show a couple takeaways.
First, we can tell that the decline in stock prices typically precedes a recession. If investors believe growth will decline and the output of the economy will contract, they’ll expect future corporate earnings will decline, and they will not be willing to pay as much for a future dollar of earnings, thus you should see stock prices drop.
Secondly, while the duration of recessions can sometimes be ephemeral and the percentage change in GDP appear to be immaterial, the magnitude of decline in stock prices can be relatively severe.
Take the technology, media, and telecommunications (TMT) bubble that burst in 2000, for example. While the recession only lasted eight months, the S&P 500 declined by 49% from March 24, 2000, to October 9, 2002. An investor would have seen half their wealth evaporate during this time period. Similarly, while the Great Financial Crisis (GFC) lasted one year and six months, the S&P 500 declined by 57% from October 9, 2007, to March 9, 2009.
While market cycles exhibit much wider swings than the relative change in an economy’s business cycle, the two are closely related. If we think that a recession is looming in the distance, it’s likely we will see an end to the market cycle as investors try to cash in on their gains before we see an end to the business cycle.
Understanding the basics of how cycles work can help you avoid making emotionally based investment decisions that can permanently impair your portfolio. Part of managing through a cycle and staying on track to meet your financial goals is to not chase returns when it seems like everyone else is buying towards the later stages of a cycle. As the old Warren Buffet adage goes, “Be fearful when others are greedy and greedy when others are fearful.”
Important Disclosures
Aspiriant is an investment adviser registered with the Securities and Exchange Commission (SEC), which does not suggest a certain level of skill and training. Additional information regarding Aspiriant and its advisory practices can be obtained via the following link: https://aspiriant.com.
Investing in securities involves the risk of a partial or total loss of investment that an investor should be prepared to bear.
Any information provided herein does not constitute investment or tax advice and should not be construed as a promotion of advisory services.
The views and opinion expressed herein are those of Aspiriant’s portfolio management team as of the date of this article and may change at any time without prior notification. Any information provided herein does not constitute investment or tax advice and should not be construed as a promotion of advisory services.
Past performance is no guarantee of future performance. All investments can lose value. Indices are unmanaged and you cannot invest directly in an index. The volatility of any index may be materially different than that of a model. The charts and illustrations shown are for information purposes only. All information contained herein was sourced from independent third-party sources we believe are reliable, but the accuracy of such information is not guaranteed by Aspirant. Any statistical information in this article was obtained from publicly available market data (such as but not limited to data published by Bloomberg Finance L.P. and its affiliates), internal research and regulatory filings.
*National Bureau of Economic Research. (2019) US Business Cycle Expansions and Contractions.

 Talk to us


