Part I: Fractures in our economic foundation
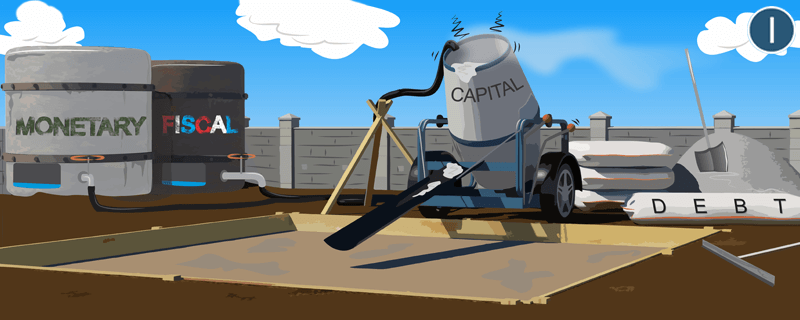
Building a structural foundation requires planning, framing and supports. Likewise, creating a sturdy economic foundation requires laws, rights and consequences. In practice, a strong economic foundation also consists of a mixture of financial liquidity and debt capacity, two necessary elements that facilitate spending and serve as critical underpinnings of the country’s capital base and related financial markets.
Insufficient liquidity and excessive debt strain the lattice of economic and market relationships, causing fractures that can eventually lead to social unrest. That’s because the foundation supports the country’s overall standard of living, which measures the broad but not universal socioeconomic opportunity available to its citizens.
Since these are complicated but interrelated topics, our Second Quarter Insight consists of three parts. In this Part I, we expand on the mounting challenges facing the economy and markets in the United States. In Part II, we discuss the limited monetary and fiscal options available to deal with those problems. And in Part III, we touch on the widening and galvanizing divides complicating political solutions to address these imbalances.
Feeling good for another fleeting moment?
First, the good news. The U.S. is officially in its longest expansion, breaking the previous record set between March 1991 and March 2001.1 As shown in Figure 1, the unemployment rate is currently 3.6% (the lowest since 1969), and the increase in year-over-year average hourly wages is at 3.4%, the highest in a decade.
At the same time, Figure 2 indicates consumer 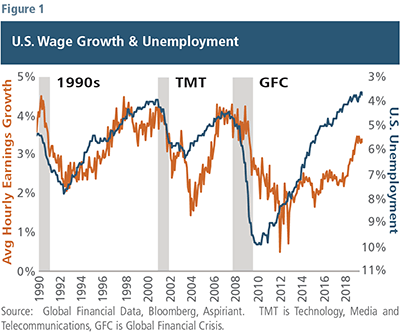
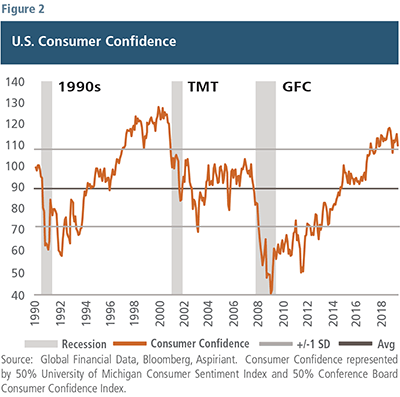 confidence is also near an all-time high. If you have a job and your wages are increasing, you’re generally more confident than if you’re unemployed or being asked to take a pay cut. Moreover, a wealth effect often occurs as both housing prices and financial markets tend to rise together when the economy expands. Secure employment, higher wages and more wealth all lead to higher levels of confidence.
Unfortunately, investors often inappropriately project recent positive developments into the future, believing the good times will continue forever. However, counter-intuitively, when everything seems to be going well from the consumer’s perspective, imbalances are emerging elsewhere, and tough times can be right around the corner.
To illustrate the point, we overlaid economic recessions onto each of the charts. For example, each time the consumer confidence index reading approached 100, a recession occurred. Admittedly, it took 49 months for the economy to crest before the Technology, Media and Telecommunications (TMT) rollover. And, before that pullback occurred, consumer confidence hit 128. So, these things can take time to unfold. But, eventually investors suffered a severe pullback, with passive investors in S&P 500-based index funds experiencing a drawdown of 49% in their portfolios.
As of July, consumers have been feeling great for the past 32 months, recently hitting an overall confidence level of 110. Rather than interpreting that high confidence as a good sign, we see it as a warning signal. As Warren Buffett advises, rather than feeling confident when things seem to be going well, “Be fearful when others are greedy and greedy when others are fearful.”
Seemingly strong, apparently weak
The tailwinds from monetary and fiscal stimulus have also produced peak levels of corporate profitability. However, as stimulus has waned, the U.S. economy has shown clear signs of slowing. We‘re starting to see decelerating growth flow through to weaker-than-expected corporate revenue and profitability. In fact, more than 80% of S&P 500 companies slashed their profit expectations2 leading up to the current earnings season. Wall Street followed suit, slashing company earnings projections at the fastest pace in nearly three years.
In and of itself, a flurry of downward earnings revisions aren’t necessarily unusual just prior to a reporting period. Companies generally prefer to provide advance notice of bad news, and a few may be interested in managing expectations by lowering the bar before they report. But the extent of the negativity this time around is notable and possibly represents growing concern.
Figure 3 shows the actual and expected 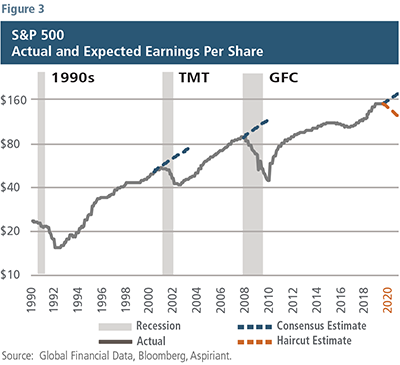 consolidated earnings per share of the companies in the S&P 500 index. The “consensus estimate” represents the combined average of dozens of equity analysts’ earnings expectations for the underlying companies. We have applied a “haircut” to their estimates to roughly reflect a more realistic expectation should the economy decelerate. Our objective with this analysis is not precision, but instead to provide a ballpark estimate of what might be more likely to occur in the future based on what’s actually occurred in the past.
Businesses have begun to respond to the softening growth by pulling back on hiring, spending and investment. Although by no means a recession yet, the economy’s slowing has been meaningful enough to prompt the U.S. Federal Reserve to respond by announcing its openness to lowering interest rates.3 In fact, the Fed cut the Federal Funds Rate by 0.25% on July 31, the first reduction since the Global Financial Crisis (GFC).
Regardless, the Fed’s decision to loosen policy, as well as other widely expected rate cuts, will only provide negligible additional stimulus. So, one of our primary concerns is how much businesses will continue to pull back and whether their actions will be meaningful enough to reduce jobs, depress wages and impair confidence.
Referring to Figures 1, 2 and 3, it’s interesting to note that rollovers tend to occur both swiftly and severely. That’s because circumstances (softening growth) lead to actions (businesses pulling back), which generate responses (consumers spending less). These related dynamics can result in self-reinforcing outcomes, like a downturn.
Why worry?
Over the past decade, much of the economic expansion and equity performance has largely been driven by monetary and fiscal stimulus. During that time, both sets of policies have generally been accommodative. The net impact has been to extend the already stretched economic cycle and bull market. However, as we further explore in Part II, the stimulative effects provided by monetary and fiscal policies have largely been exhausted.
Notwithstanding that predicament along with a host of other warning signals,4 equity markets appear unworried. In fact, we think many investors are either unaware or unconcerned about these circumstances. As shown in Figure 4, the current valuation of the S&P 500 indicates investors are expecting continued great news: higher levels of growth, employment, wages, confidence and profitability above today’s peak levels. If those conditions don’t materialize, risky portfolios may suffer significant losses.
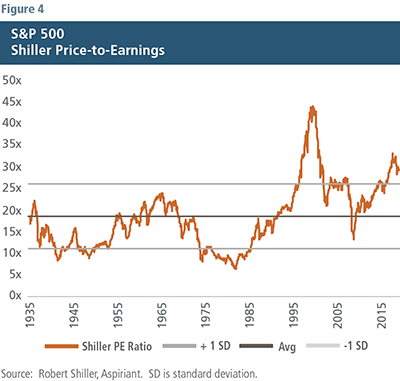
We’re expecting quite the opposite: lower growth, employment, wages, confidence and profitability going forward. As a result, we’re expecting much lower equity valuations and have shaped our investment allocations accordingly.
It’s important to note that we’re not expecting a wide-spread, deep or prolonged economic recession. However, it seems obvious to us that the risk of one occurring has increased dramatically over the past several quarters. And, it seems equally obvious that the monetary and fiscal tools our country has relied on in the past to curtail a downturn will be markedly less effective. So, policymakers’ next best option is a well-planned and broadly supported series of pro-employment, pro-business and pro-market policy changes that would provide meaningful benefits to the country for many years to come. Although not impossible, given the country’s current political divides, we think such an outcome is highly implausible. We discuss this more in Part III.
Recession probability ticking upward
Flattening interest rates and overly tight labor markets5 are often cited as harbingers of an imminent recession. As shown in Figure 5, the Federal Reserve Bank of New York uses these data inputs to create a recession probability index. It indicates the likelihood that a recession will occur in the ensuing 12 months.
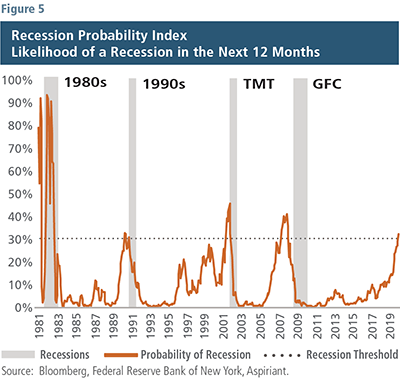 The index exceeded a probability of 30% on four occasions, and each time a recession occurred: the early 1980s, the early 1990s, the TMT and the GFC. The index has jumped over the past few quarters and currently stands at 33%, which should serve as another signal for heightened caution among investors.
Even before the Fed’s pivot on rates earlier this year, many economists expressed concerns about the rising risks of recession. Case in point, a recent survey of 281 business economists indicated that more than 40% of the respondents expect a recession in 2020. Although the U.S. continues to show signs of economic strength, underlying weakness is emanating from a global slowdown exacerbated by ongoing trade disputes and the fading impacts of the 2017 tax legislation and 2018 budget deal.
How the future unfolds
We acknowledge that stable, low growth combined with stable, low inflation may very well support stable and stubbornly high equity valuations. In other words, we may not get a severe pullback in equities. However, should that scenario unfold, future equity returns would likely be well below their historical averages for a very long time — perhaps a decade or longer. We would expect that environment to grind on until corporations slowly grow into the valuations currently being assigned by the marketplace.
Another more likely scenario is that the economy does indeed dip into a recession. Up to this point, every problem we’ve faced has been cured with lower interest rates and late-cycle deficit spending. However, as we further explore in Part II, the Federal Reserve has little room left to rekindle a faltering economy. In addition, the U.S. Treasury is already expecting a $900 billion deficit, which is a headwind to additional government spending. Finally, as we discuss in Part III, given our galvanizing political divides, the potential for any broadly supported congressional solutions seems remote. Moreover, the arrival of any political cures would likely be delayed, contentious and ineffective.
Given this backdrop, we believe the next recession could be accompanied by a unique set of risks. While we cannot with any accuracy predict the timing of that occurrence, we believe now is the time to be prepared.
Endnotes
1Source: National Bureau of Economic Research.
2Source: Bloomberg, July 7, 2019.
3For a broader discussion, see our Q1 2019 Insight.
4For additional examples, see our Q3 2018 and Q4 2018 Insights.
5The unemployment gap is the difference between the non-accelerating inflation rate of unemployment (NAIRU) and the unemployment rate. The NAIRU — or non-accelerating inflation rate of unemployment — is a benchmark for assessing the degree of spare capacity and inflationary pressures in the labor market. When the observed unemployment rate is below the NAIRU, conditions in the labor market are tight and there will be upward pressure on wage growth and inflation. When the observed unemployment rate is above the NAIRU, there is spare capacity in the labor market and downward pressure on wage growth and inflation. The difference between the unemployment rate and the NAIRU – or the “unemployment gap” — is therefore an important input into the forecasts for wage growth and inflation.
Important disclosures
Past performance is no guarantee of future performance. All investments can lose value. Indices are unmanaged and have no fees. An investment may not be made in an index. The volatility of any index may be materially different than that of a model. The charts and illustrations shown are for information purposes only.
Equities. The S&P 500 is a market-capitalization weighted index that includes the 500 most widely held companies chosen with respect to market size, liquidity and industry.

 Talk to us


