Part II: Guessing leads to mistakes
Throughout the course of our careers, we have come to realize many investors perform little to no analysis prior to making investment decisions. This is referred to as price indiscriminate buying or selling, which tends to push stocks, especially growth stocks, to extremes during prolonged expansions or contractions. Our concern is particularly acute for individual investors who tend to buy securities when they have more disposable income, whether generated by a strong economy or a windfall such as stimulus checks. Likewise, they tend to sell securities when they have less disposable income.
These price indiscriminate buyers and sellers broadly consist of three groups. Day traders treat investing like a game, buying message board stocks (e.g. GameStop, AMC, Hertz) thinking they will outsmart others by selling before the price drops — although studies have found they almost never make money.1 Speculators purchase yet unproven companies (e.g. relatively new, unprofitable). They like to “get in early” during public offerings and often use margin to amplify outcomes.
Lastly, passive investors buy low-cost, market-cap weighted funds, which on the surface doesn’t seem like a terrible approach. However, by construction, these funds become overly exposed to securities that have done well recently. In fact, even the late John Bogle of Vanguard, who is widely considered the pioneer of passive investing, remarked at Berkshire Hathaway’s 2017 annual meeting:
If everybody indexed, the only word you could use is chaos, catastrophe. The markets would fail.
That’s because a key assumption underlying passive investing is the financial market consists of a broad and deep group of skilled, active investors who collectively establish fair prices for securities. When that condition holds, passive investors essentially “free ride” on that process of price discovery, which helps ensure the prices they’re paying for the underlying securities in an index are reasonable relative to their expected returns. However, a passive fund cannot choose which securities it holds. Rather, it must hold all securities in its index in proportion to their market capitalization, regardless of whether prices are being set by skilled investors or other price-agnostic investors such as day traders, speculators and other passive investors.
The interplay across these groups of investors often leads them to pile into the same stocks at the same time. For a while, that “virtuous” relationship probably feels pretty good — what I bought yesterday, you bought today, so I’ll buy more tomorrow. However, as John Bogle cautioned, price indiscriminate buyers become price indiscriminate sellers when the environment changes, which could lead to a downward spiral in prices as investors head to the exits.
Since each of these investor groups perform virtually no analysis whatsoever, we believe they have all contributed to the overpricing of global growth stocks, which we detailed in Part 1 of the First Quarter 2021 Insight. Below, we share more evidence supporting our thesis.
A positive divided by a negative?
Figure 1 shows the percentage of companies with negative earnings filing for initial public offerings (IPOs) overlaid with the periods in which the S&P 500 experienced a drawdown of 10% or more during a period of at least three months. We have color-coded each decade to highlight that the drawdowns generally coincided with the secular peaks for these IPOs. Analyzing the data in this manner also acknowledges changes in both underwriting and accounting standards over time.
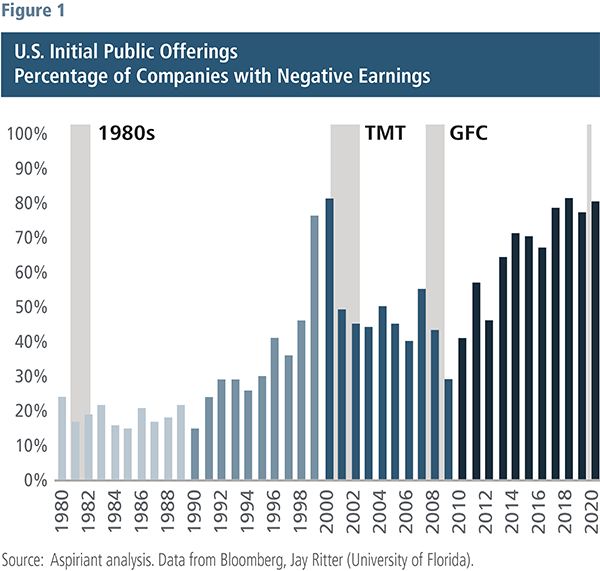
Although the chart isolates drawdowns of at least 10%, it’s important to note that the actual maximum drawdowns were significantly more severe: 27% in the early 1980s, 49% in the late 1990s and 57% in the mid-2000s. It’s equally important to note the drawdown periods didn’t last forever. On average, they began and ended within about 18 months, fully recovering the value lost during each period. Finally, each of the drawdowns offered savvy investors buying opportunities to earn extraordinary returns along the way. But they had to have the analytical framework and emotional fortitude to become aggressive when others were paralyzed by fear.
So, why have the peaks for these IPOs coincided with meaningful drawdown periods? Some might conclude the occurrence exemplifies the strength and depth of the capital markets’ abilities to look through recent results and evaluate new business models and technologies. On the contrary, we take it as a sign that bad deals are likely getting done. In fact, we believe these companies and their underwriters are attempting to push through as many deals as possible before capital markets no longer support questionable offerings. Doing so often means persuading investors that the company’s poor performance will improve, even when that result is unlikely.
SPACs: Lots of people taking shortcuts
Figure 2 highlights the latest trend impacting the markets: special purpose acquisition companies, or SPACs. SPACs enable operating companies to go public by essentially shortcutting the (arguably insufficient) scrutiny of initial public offerings’ regulatory and underwriting reviews. SPACs are “blank check companies” in which the sponsors raise capital and get listed on an exchange first, and then identify a business to invest in later.
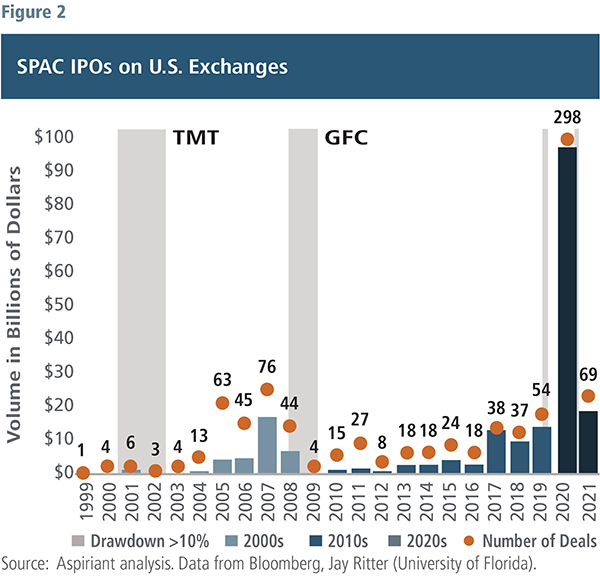
While most skilled investors would avoid these shortcut transactions, speculators seem to have an insatiable appetite for them. Indeed, dollar volume in 2020 alone exceeded the combined total of all other SPACs funded in the previous 30 years. This risky form of public offering accounted for roughly half of IPOs in 2020.
Importantly, speculators are not the only ones investing in unprofitable and unproven companies via IPOs and SPACs. Eventually, when their market capitalizations rise, index providers often consider adding them into market-cap weighted portfolios. Therefore, passive investors also end up owning these companies, but typically not until they have dramatically increased in price. Case in point: Tesla was added to the S&P 500 index in December 2020 after it already had a market capitalization of nearly $700 billion and had just generated its first annual profit (largely due to the sale of regulatory tax credits) in its 17-year history.
Bubbles burst
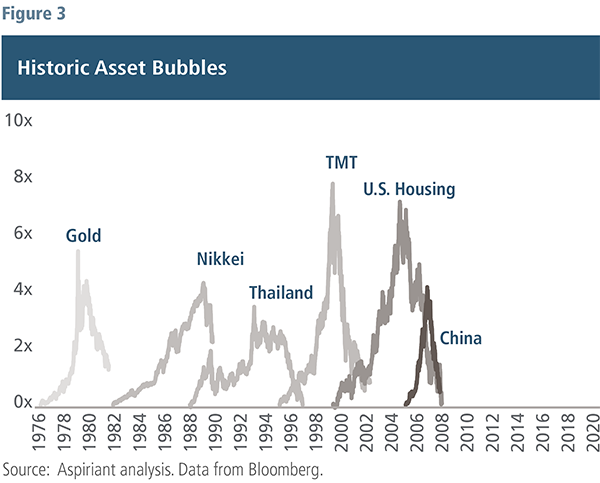
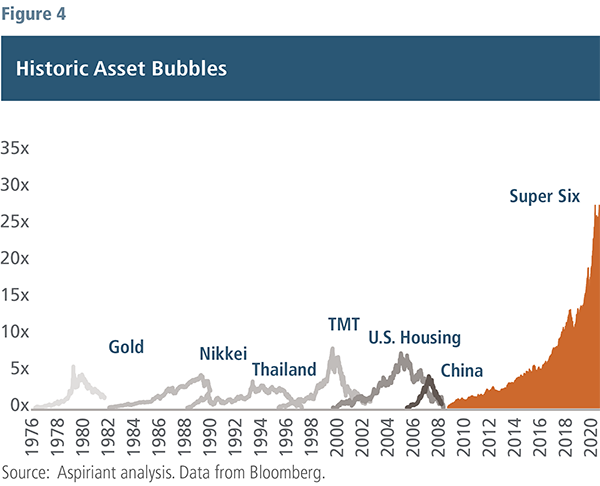
It’s critical that investors study past asset bubbles in order to recognize and avoid them in the future. Figure 3 captures six such examples since the late 1970s. Four important observations can be made:
- Bubbles have occurred much more frequently2 than they should if markets were always efficient
- Bubbles occurred across broad and disparate asset classes, countries and sectors
- Popularity propelled each bubble to extraordinary heights over relatively short periods of time (average bubble shown increased 6x over 50 months!)
- All bubbles burst, with no exceptions, losing an average of 70% over the 28 months following their peak price
Remarkably, comparing the Super Six, which are the FAANGs (Facebook, Apple, Amazon, Netflix and Google/Alphabet) plus Microsoft, appears to turn those mountains into molehills. As shown in Figure 4, the Super Six are up 26x since 2009! As a result, they currently represent 23% of the S&P 500, exceeding 17% record set in the dot-com bubble. As a point of reference, the S&P 500 sold off 47% in the 25 months following the peak of the late 1990s frenzy. To put their sheer size into perspective, the collective market capitalization of the Super Six is $7.8 trillion, exceeding the GDP of every economy except China and the U.S.
Suffice it to say, we have a difficult time believing that any rigorous analysis is being done by the people driving the prices of these stocks.
Great companies, bad valuations
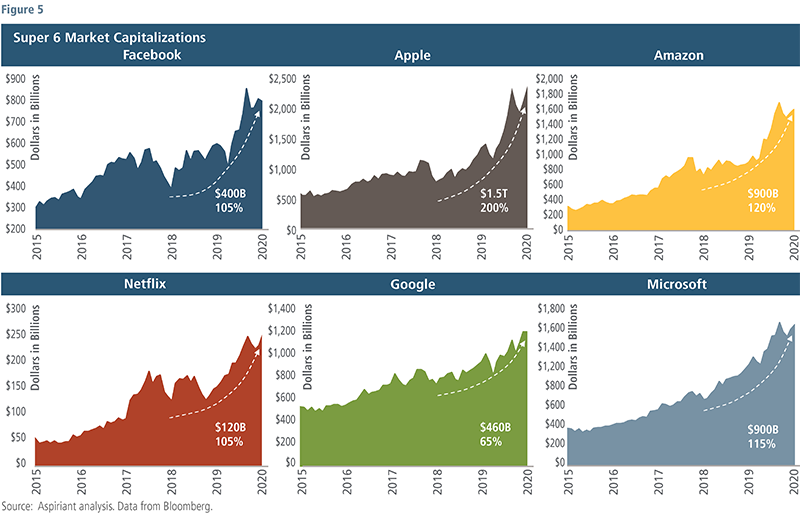
The Super Six warrant a deeper discussion. Figure 5 isolates the price action of each of these stocks over the past five years, with special attention to calendar years 2019 and 2020. With the sole exception of Google/Alphabet, each of these stocks was up 100% or more on a cumulative basis, adding about $3.4 trillion in aggregate wealth for their collective shareholders over the past two years.
We consider Apple one of the world’s best run organizations, adding value to its customers, employees, suppliers and shareholders over several decades. But, even one of the most highly regarded companies can become sorely overvalued.
Of these six companies, Apple had the highest return across 2019 and 2020, skyrocketing 200% across those two years, generating $1.5 trillion in additional wealth for Apple shareholders. Allowing for some slight imprecision because of different fiscal years, the other five companies had total sales growth ranging from approximately 30% to 60% during that period. Good, but in most environments not good enough to warrant a 100%-plus jump in the stock price inside of two years.
However, excluding its first quarter 2021 results that were just released, Apple had two-year sales growth of a little more than just 3% — total, not annualized. Shares climbed 200%, but sales barely moved. What about earnings? Over the same two years, profits declined 4%! Granted, Apple’s most recent quarter, announced in late January and traditionally its best quarter since it includes the important year-end holidays, was reasonably strong with sales up 21% year over year due to the introduction of the new iPhone. But even with that news, Apple is not much different a company compared to two years ago. Yet, its market value has tripled.
And how big do you think the Super 6 can get? Apple alone is close to $2.5 trillion. We never had a trillion-dollar market cap company until August of 2018. Now we have an entire set of them. The math just gets harder and harder to reconcile.
By no means is the recent rapid price ascension and detachment from fundamentals unique to the Super Six. Tesla is up 12x over the past two years and now more valuable than just about all the traditional car manufacturers combined. Video game retailer GameStop rose 30x in January related to extreme speculation by day traders. Likewise, AMC Theatres was up 9x over a similar period.
Think different
In a market flooded with liquidity (by both fiscal and monetary channels), it is not surprising to see money find its way to the stocks that purportedly offer the most immediate (and spectacular) payouts. Penny stocks, which are thinly traded and heavily shorted, can surge exponentially with loosely coordinated activity among eager buyers. Newly traded stocks that take an accelerated and less scrutinized path to public markets, and in almost all cases, with low or negative earnings, offer the promise of a rapidly scaling business and being hailed as the next Tesla or Facebook. And growth stocks, most notably the Super 6, have compounded shareholder capital by unprecedented amounts over the past several years, leading many to believe the past will carry well into the future. Add some leverage (margin debt is at a record level) to further amplify the expected gains, and you have a dangerous set of conditions for investors.
As history has shown time and again, these current excesses will recede, often violently. We cannot be certain of when, only the result. Accordingly, we suggest investors limit their exposure to many of these opportunities. Yes, you can own some growth companies, especially ones with strong balance sheets and a history of posting high and sustainable returns of capital, but do so selectively.
To durably earn profits over the next several years, investors must actively hold assets that are dissimilar to a globally balanced benchmark. Among riskier assets, we have a bias toward value stocks, particularly international markets, along with gold and other real assets. For capital preservation, we suggest holding less fixed income and instead use diversifiers that don’t move in tandem with market fluctuations as an effective substitution. As the late Steve Jobs professed, now is the time to think different.
1Barber and Odean (2000), “Trading is Hazardous to Your Wealth: The Common Stock Investment Performance of Individual Investors.” Chague, De-Losso, Giovannetti (2020), “Day trading for a living?” Author found 97% of investors who traded for more than 300 days lost money in the Brazilian equity futures market. Barber, Huang, Odean, and Schwarz (2021), “Attention-Induced Trading and Returns: Evidence from Robinhood Users.” Authors found that crowding behavior typically forecasts negative returns in the following 20-day period with an average of -4.7% or -19.6% in the event of extreme crowding behavior.
2If markets were always efficient, bubbles (defined as two standard deviation events) would be random, occurring about once every 40 years.
Important disclosures
Aspiriant is an investment adviser registered with the Securities and Exchange Commission (SEC), which does not suggest a certain level of skill and training. Additional information regarding Aspiriant and its advisory practices can be obtained via the following link: https://aspiriant.com.
Investing in securities involves the risk of a partial or total loss of investment that an investor should be prepared to bear.
Any information provided herein does not constitute investment or tax advice and should not be construed as a promotion of advisory services.
The views and opinion expressed herein are those of Aspiriant’s portfolio management team as of the date of this article and may change at any time without prior notification. Any information provided herein does not constitute investment or tax advice and should not be construed as a promotion of advisory services.
Past performance is no guarantee of future performance. All investments can lose value. Indices are unmanaged and you cannot invest directly in an index. The volatility of any index may be materially different than that of a model. The charts and illustrations shown are for information purposes only. All information contained herein was sourced from independent third-party sources we believe are reliable, but the accuracy of such information is not guaranteed by Aspirant. Any statistical information in this article was obtained from publicly available market data (such as but not limited to data published by Bloomberg Finance L.P. and its affiliates), internal research and regulatory filings.
The S&P 500 is a market-capitalization weighted index that includes the 500 most widely held companies chosen with respect to market size, liquidity and industry.

 Talk to us


