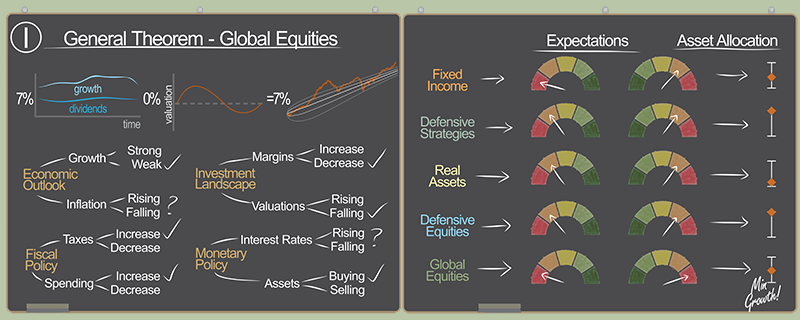
Part I: The problem with fuzzy math
Anyone who understands the mathematical relationship between the price of a stock or bond and its future cash flow (dividend or coupon) knows that many of today’s asset valuations simply do not pencil out.
A flood of price-indiscriminate buyers in recent years (day traders, speculators and passive investors) have driven many impossible-to-justify results. These “bad students” have seemingly bypassed the prerequisites in understanding the expected return of a security. Instead, they simply bought more of what recently increased in price. Without any change in the underlying cash flows produced by a security, the only thing certain when buying a more expensive asset is its expected return is necessarily lower. And when reflexive buying becomes extreme, future returns compress further, eventually turning negative. At that point, the only way the securityholder earns a short-term profit is by offloading the overpriced asset to another unwitting buyer, commonly known as the Greater Fool Theory.
By our calculations, a confluence of factors — including the trend in market-cap weighted portfolios, record-setting fiscal and monetary stimulus, and a swell in day-trading activity — has stoked certain areas of the current investment landscape to inexplicable extremes.
With dangers multiplying, we felt compelled to publish two parts to our First Quarter 2021 Insight. In this Part I, we discuss our forward-looking Capital Market Expectations (CMEs), which capture the overall investment landscape and the areas we believe offer attractive opportunities. In Part II, we take a deeper dive into the speculative excesses prevalent in today’s market, with particular attention given to growth stocks, including the tech Super 6.
Avoid the guesswork
Serious investors employ an analytical approach to assess the set of opportunities competing for their capital. By contrast, bad investors like bad students believe studying is a waste of time. So, they make careless, erroneous assumptions; a common one is believing the future will resemble the recent past. For example, looking backward, they might conclude that passively owning the market via a global balanced portfolio would be a sound decision going forward. We believe otherwise and think these investors risk being caught off guard, failing to notice how drastically conditions have changed and unintentionally endangering their capital over the next several years.
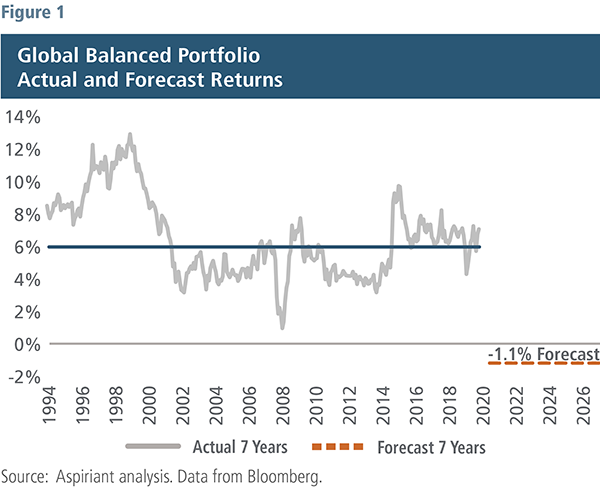
To illustrate the point, the gray line in Figure 1 represents the annualized returns generated by a global balanced portfolio over seven-year rolling periods dating back to 1994. About half the time, the portfolio either outperformed or underperformed an average annualized return of 6%.1 We think many investors would be satisfied earning that kind of return going forward. Unfortunately, past performance is not indicative of future results, which seems obvious given the significant difference between actual and average historical returns at any point in time.
So, to better understand and prepare for the future, we develop forward-looking, seven-year annualized return forecasts across dozens of asset classes, which we call CMEs. Our current CME for a global balanced portfolio suggests an incredibly challenging environment in the years ahead for market-cap weighted portfolios.
Indeed, over the next seven years, we expect the portfolio to generate an average annualized return of -1.1%, which means the portfolio’s value would be about 7.5% lower in 2027. Naturally, actual results will vary, either above or below our assumptions. Obviously, a negative return could severely impair financial planning goals, perhaps forcing passive portfolio investors to make difficult decisions in the years ahead.
Make educated decisions
Unlike the past several years, we believe the path to earning a reasonable return going forward is owning a portfolio that’s dramatically different than the market. That means pursuing portfolio allocations that are distinct from a simple market capitalization-weighted approach.
Our CMEs provide the calculus to such an alternative. These mathematical forecasts indicate which asset classes should receive the highest or lowest weightings in a portfolio. For example, our forecasts for global value stocks are flat to reasonably positive (Figure 2). Consequently, we want to hold a significant allocation to those asset classes after considering other risk management factors.
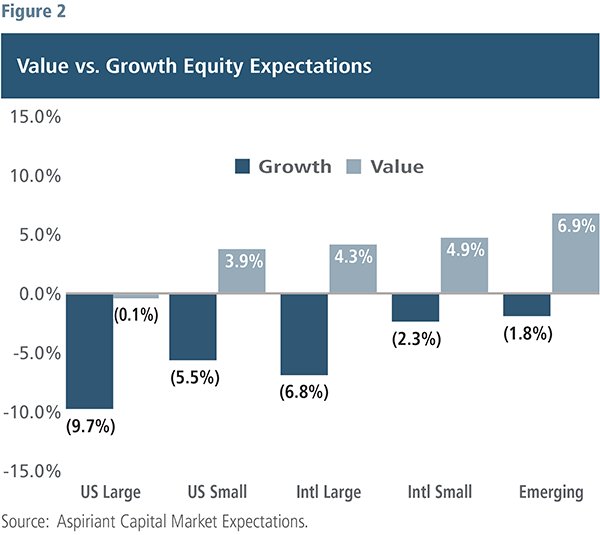
On the other hand, our forecasts for global growth stocks are all negative (some sharply), suggesting these asset classes could very well lose money over the next seven years. For example, passively owning U.S. large cap growth stocks at a -9.7% annualized forecast could result in a decline of roughly 50% in that portion of an investor’s portfolio!
To be clear, we’re not saying all large cap growth stocks around the world will become horrible investments. But, as we’ve discussed,2 we expect many of them to come under pressure. Consequently, except for high-quality companies, we believe in owning the bare minimum today.
Implications of Policy Changes
In addition to our CMEs, we strive to understand the overall economic outlook. That’s because business cycles and market cycles are interconnected.3 For example, fiscal and monetary policies can either extend or end a business cycle and therefore a market cycle. So it’s critically important to have a view on what policymakers are likely to do in terms of fiscal and monetary policy.
Like other central banks, the U.S. Federal Reserve attempts to achieve two broad mandates: maximizing employment and stabilizing inflation. It pursues those objectives by setting the level of interest rates and asset purchases or sales. Likewise, legislators use taxing authority and spending powers to redistribute a country’s financial resources.
Actions taken by these policymakers can alter, at least temporarily, the outcomes otherwise expected by our CMEs. Therefore, we strive to predict what’s more or less likely to occur when it comes to policy change. Today, we see an environment ripe for additional stimulus, which informs our portfolio construction process.
Room for more stimulus
Given the lingering disruption from the pandemic, economic and employment weaknesses show up across a variety of statistical measures. Consumer price inflation (CPI), a reading closely watched by monetary authorities, has unsurprisingly dropped over the past year from about 2% to nearly 1% (Figure 3). This drop repeats a pattern seen in prior recessions: the Technology, Media and Telecommunication (TMT) bubble in the early 2000s and the Global Financial Crisis (GFC) of 2008 and 2009.
For much of the past 25 years, inflation has oscillated around 2%. With low inflation and unemployment today near 7%, almost double the pre-pandemic level, the Federal Reserve has the runway to keep its accommodative policies in place for the foreseeable future.
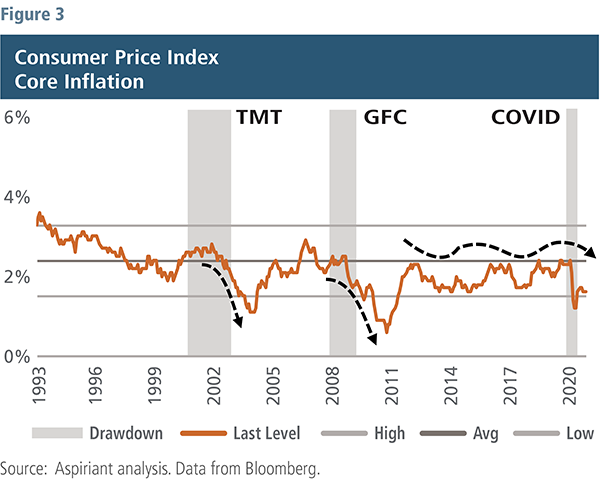
One nuance to Fed policy, and this further reinforces their desire to keep interest rates low and asset purchases in place, is that U.S. monetary authorities seem to have pivoted from proactively seeking to tamp down inflation to a posture of counteracting deflation or a period of falling prices. The circumstance that policymakers fear is that lower expected future prices cause consumers to defer purchases, which lowers spending and incomes (as one person’s spending is another person’s income) and prompts a downward economic spiral. With nominal interest rates at or near zero, moving from inflation to deflation causes a rise in real interest rates or a tightening of monetary conditions at the worst possible time, and hampers economic activity even more.
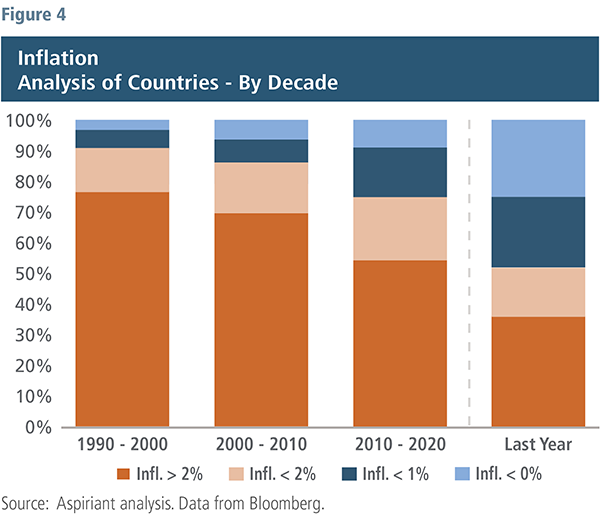
The deflationary trend has been a global phenomenon. As shown in Figure 4, the past 30 years have been disinflationary, characterized by falling inflation. In the decade of the 1990s, 77% of countries (in dark orange) had inflation that averaged more than 2% over that decade, with only 3% of countries (in light blue) experiencing deflation, or falling prices. Contrast that with 2020, where fewer than 40% of countries reported inflation of above 2% for the year, and 25% of countries registered price changes below zero.
Exponential debts and deficits
Given these concerns, it’s understandable the Fed responded to the pandemic with unprecedented levels of stimulus. Figure 5 examines the size of the Fed’s balance sheet, which on the asset side of the ledger is made up almost entirely of U.S. Treasury and mortgage-backed securities. From the pandemic’s onset in February through year-end 2020, the Fed’s balance sheet increased by about $3.2 trillion — again, within 10 months or so. And the Fed is adding to that sum each month with $120 billion of asset purchases. That support provides liquidity to the market and, just as importantly, serves as a check or restraint on long-term interest rates.
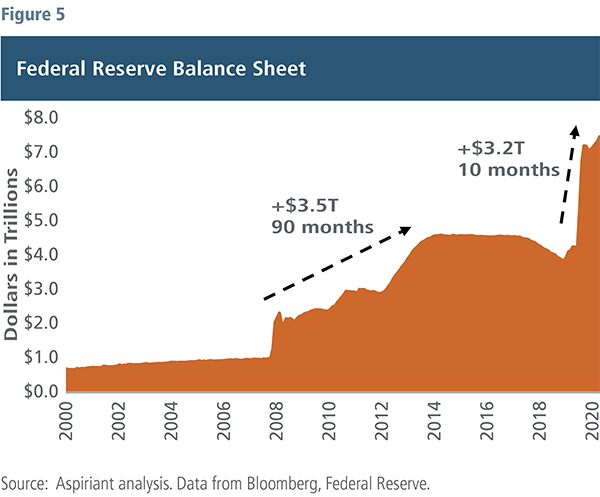
In comparison, the Fed’s balance sheet ballooned by a similar amount during and after the GFC, but that expansion spanned a seven-year period.
At the same time, legislators injected even greater stimulus into the economy, spending massive amounts of money, as shown in Figure 6. Coming into 2020, the U.S. was running a trillion-dollar budget deficit, equal to about 5% of GDP. That level by itself is elevated from the post-war average deficit amounting to 2% of GDP.
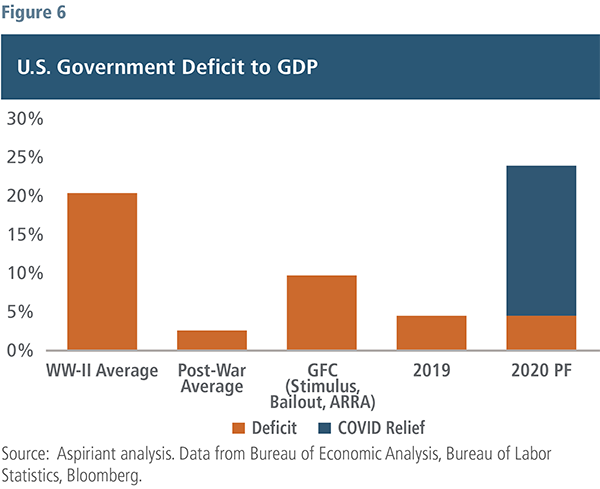
Since March 2020, following passage of the CARES Act and the December relief legislation, about $4 trillion of additional spending has been authorized. Add the structural deficit of $1 trillion to the $4 trillion of relief packages, and you get to a proforma calendar year deficit of $5 trillion, or about 23% of GDP. That budget shortfall is more than double the level reached during the GFC and on par with what we spent to win World War II. Just staggering figures.
And Congress may not be done. The Biden administration is actively pursuing another $1.9 trillion relief measure.
Value equities: Supported by CMEs and stimulus
Given the extraordinary rise in the Super 6 (Facebook, Apple, Amazon, Netflix, Google/Alphabet and Microsoft) it’s not surprising growth stocks have had an impressive run of outperformance. Over the past 10 years ending December 2020, growth stocks outperformed value stocks on a cumulative basis by over 200%, as shown in Figure 7. That level of outperformance surpasses the prior extremes achieved in the late 1990s during the TMT bubble, the next two bars to the left.
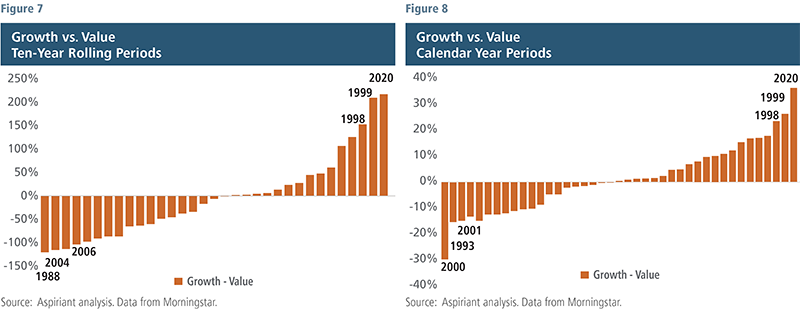
The relative outperformance of growth stocks is even more extreme if measured over a shorter time frame, such as a calendar year. The wider separation is shown in Figure 8, with growth outperforming value by roughly 36% in 2020, with the next closest episode of outperformance being the 26% difference achieved in 1999. The continuation of this run requires a belief that the greatest performance gap on record will become even more extreme.
It’s worth noting that following similar levels of outperformance of growth stocks in the 1990s and the implosion of that cycle in 2001, value stocks outperformed growth, on a cumulative basis, by about 100% over the next 10 years. Value stocks in our view are just a better risk reward opportunity. That’s not always the case, but we believe it to be true today.
The Case for Value
Admittedly, value stocks have had a difficult run over the last several years. What makes value better positioned today? Value stocks trade at more sensible valuations in relation to growth stocks and in regard to their own history. Value stocks generally offer higher dividends, a more durable and less risky source of return. Value stocks are concentrated in more economically sensitive sectors such as financials, industrials, energy and large cap pharmaceuticals. Value portfolios include names such as J.P. Morgan, Johnson & Johnson, Pfizer, Comcast and Berkshire Hathaway — good companies that should benefit as economic activity normalizes.
If history is any guide, value stocks usually outperform in the early years of an economic cycle, a period that should begin to materialize once we get through this recent surge in COVID cases. In fact, the rotation into value stocks has already started to occur. Following the announcement of multiple, highly effective vaccines in November, value outperformed growth in the final quarter by about 4%. We expect that trend to continue, with some fits and starts, into this year.
Outlook and portfolio positioning
In light of swelling case counts, lock downs, social distancing and reduced mobility, economic activity remains impaired in the near-term. Fortunately, vaccines are now becoming more widely available. So by the summer or third quarter, we should be on path to more regular economic conditions. The sustainability of that recovery, as we have noted before, will be dependent on the quality and scale of our policy solutions.
The Fed’s policy should be a bit more predictable, with lower interest rates for longer and continued asset purchases to curb long-term interest rates. Fiscal policy, for sure, has more risks given the thin majorities in Congress and the polarization of the parties. President Joe Biden has an aggressive agenda targeting pandemic relief, healthcare access, green energy, education and other areas. And he has proposed a range of tax increases to help fund these plans. We think it unlikely tax policy significantly changes in 2021 due to the residual effects of the pandemic. Next year may be a different story, particularly regarding corporate taxes and individual rates for high earners.
The markets, as we have noted, have moved much differently than the economy. Today, many assets are richly priced. And investors who passively own the market and all the excesses that come with it are at a greater risk of capital loss, perhaps materially so over the next several years.
We expect to generate much better outcomes while curtailing losses as they occur. Our plan for doing so remains consistent. Shape the portfolio towards those areas that offer the best prospective (not retrospective) risk-adjusted returns. Today, that means avoiding undue concentration in a narrow set of popular growth stocks, and instead owning cheaper and better-positioned value stocks. These stocks tend to do well in the early stages of an economic recovery and should benefit as vaccine distribution grows and expected government stimulus puts economies, here and abroad, on sounder economic footing in the months ahead.
We believe in global diversification, especially given the uneven speeds of the healthcare, economic and policy responses, as well as growing concerns about the long-term strength of the U.S. dollar. We continue to like defensive equities that possess cash flow and balance-sheet resiliency across a range of environments. These stocks are an exposure that should hold up reasonably well if a recovery wobbles or even slips into periods of lower or negative growth.
Lastly, we recommend holding less fixed income, given extremely low yields and asymmetric risks,4 and instead use less correlated holdings such as defensive strategies and gold to shore up the capital preservation properties of a portfolio.
1The global balanced portfolio achieved an annualized return of at least 6% in 53% of the 312 seven-year rolling monthly periods since December 31, 1994. Aspiriant expects its Moderate Portfolio, which is benchmarked against a global balanced portfolio, to also achieve an annualized return objective of CPI +4% (or roughly 6% today).
2For a broader discussion on Big Tech and growth stocks, please see our Third Quarter 2019 Insight, published in October 2019.
3For a broader discussion of business cycles and market cycles, please read The Market Cycle and the Business Cycle: A Layman’s Guide, by Ryan Nelson, Aspiriant director in investment advisory, published in January 2020.
4Downside risks outweigh the upside opportunities.
Important Disclosures
Aspiriant is an investment adviser registered with the Securities and Exchange Commission (SEC), which does not suggest a certain level of skill and training. Additional information regarding Aspiriant and its advisory practices can be obtained via the following link: https://aspiriant.com.
Investing in securities involves the risk of a partial or total loss of investment that an investor should be prepared to bear.
Any information provided herein does not constitute investment or tax advice and should not be construed as a promotion of advisory services.
The views and opinion expressed herein are those of Aspiriant’s portfolio management team as of the date of this article and may change at any time without prior notification. Any information provided herein does not constitute investment or tax advice and should not be construed as a promotion of advisory services.
Past performance is no guarantee of future performance. All investments can lose value. Indices are unmanaged and you cannot invest directly in an index. The volatility of any index may be materially different than that of a model. The charts and illustrations shown are for information purposes only. All information contained herein was sourced from independent third-party sources we believe are reliable, but the accuracy of such information is not guaranteed by Aspirant. Any statistical information in this article was obtained from publicly available market data (such as but not limited to data published by Bloomberg Finance L.P. and its affiliates), internal research and regulatory filings.
The S&P 500 is a market-capitalization weighted index that includes the 500 most widely held companies chosen with respect to market size, liquidity and industry. MSCI ACWI Index is a free-float weighted equity index representing both domestic and emerging markets. MSCI ACWI Value Index captures large and mid-cap securities exhibiting overall value style characteristics across Developed Markets countries and Emerging Markets (EM) countries. MSCI ACWI Growth Index captures large and mid-cap securities exhibiting overall growth style characteristics across Developed Markets countries and Emerging Markets (EM) countries.

 Talk to us


