
IS&R Highlights
- As we begin to recover from the pandemic, supply-chain disruptions, rising inflation, increasing interest rates, geopolitical conflict and U.S. political uncertainty mean market volatility will likely continue.
- The importance of fundamentals and pricing of financial assets should re-emerge as investors become more discerning.
- Inflationary pressures have pushed the Federal Reserve onto a tightrope, balancing economic growth and full employment; one wrong step could lead to a treacherous fall.
- We expect active management to outperform passive indexing as we enter a period of greater volatility and return dispersion.
- Diversifiers and defensive equities provide a portfolio ballast and allow investors to stay more comfortably invested, avoiding the pitfalls of market-timing.
- Curated real assets offer inflation protection.
Under the Market Big-Top
The financial markets have felt a bit like a circus in recent years. We’ve watched the Federal Reserve be the ringleader while other policymakers have assisted as handlers. Collectively, they have repeatedly wowed the crowd of investors by pulling the economy and markets out of death-defying feats ─ first the Global Financial Crisis (GFC), then the infamous Fed Pivot in 2018, and most recently when the coronavirus struck in the beginning of 2020.
The performers include day traders, professional traders, passive investors and skilled investors who have rotated through their acts as the environment changed. As stimulus fades and risk-taking recedes, we see the spotlight dimming on day traders and passive investors. Going forward, we expect fundamental analysis ─ of inflation, growth, wages and interest rates, among other factors ─ to prevail. Therefore, we expect professional traders and skilled investors to take the center ring.
Moving from one crisis to another
We seem to have managed through the worst of the virus, including its variants, over the past 2-1/2 years. In the U.S., new cases, active cases, hospitalizations and deaths are at or near lows since the pandemic began. At this point, it appears COVID-19 is on a path to becoming endemic, meaning it’s likely to be another illness we must live with.
The economy has already begun to recover from the coronavirus pandemic, largely aided by $6 trillion in government stimulus. Gross domestic product (GDP) is at $24 trillion, which is back to its pre-COVID 19 trendline. However, while nominal growth has been strong, real growth ─ which excludes inflationary effects ─ is weakening. Nevertheless, the economy could maintain its balance while financial markets continue to stumble.
As we discussed in the First Quarter 2022 Insight, the demand for goods and services is outpacing supply, and that’s driving us toward full employment and a strong economy. But it’s also pushing inflation upward for seemingly everything from goods and services to wages, housing and assets. We’ve all seen and felt it ─ at the grocery store, gas pump, restaurants and more.
Meanwhile, the conflict between Russia and Ukraine has caused Europe’s largest refugee crisis since World War II, with more than 5.1 million Ukrainians, 25% of the country’s population, currently displaced. Death toll and injury estimates vary widely on both sides, as well as those reported by NATO. Regardless, the total number of military and civilian deaths and injuries will almost certainly tally in the tens of thousands. The conflict seems far from ending, but when it does, significant investment will be required to rebuild Ukraine’s homes, buildings, roads and infrastructure. In the meantime, it’s adding to existing supply-chain and inflationary troubles.
The Inflation Spiral
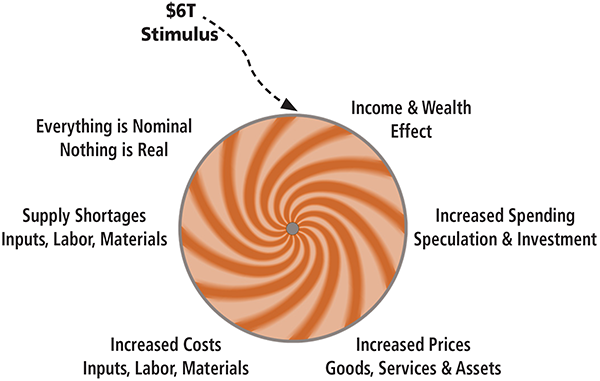
- The Inflation Spiral started spinning due to the $6 trillion of government stimulus injected into the economy following the health pandemic and ensuing social distancing that led to the economic collapse
- Then, the force of that stimulus caused an Income and Wealth Effect ─ and for a while, we all believed our wages and wealth were higher than they really are
- That led us to increase our spending and speculative investments
- Which caused higher prices for the goods, services and assets that we all wanted
- Then the increased consumer demand led to increased corporate demand for the labor and materials necessary for companies to make everything we wanted to buy
- Those effects were amplified by supply shortages for labor and materials due to the various supply chain disruptions we’ve faced across global ports and trading routes, as well as the conflict in Ukraine
- Coming full circle, we realize that everything is nominal, nothing is real. On average, we’re not actually enjoying more goods, services and assets. Rather, we’re just simply paying more for them. It’s enough to make your stomach queasy.
Monetary policy tightrope
The Fed seems to be walking a policy tightrope between interest rates and its balance sheet. Monetary tightening too quickly to control inflation would likely result in lost jobs and economic risks, possibly a recession, as employers would face higher operating costs and would likely have to slow hiring or potentially fire workers. But, tightening too slowly would jeopardize the standard of living, especially for those living paycheck-to-paycheck. Combined with a wide range of economic, market and geopolitical uncertainties, the dilemma is probably the most challenging the Fed has faced since the 1970’s.
Given the choices, we expect the Fed to tighten roughly in line, or possibly slower, than the market’s expectations. And, if the Fed doesn’t exceed the market’s interest rate expectations, the inflation spiral could continue to spin. And that would only kick the can down the road, exacerbating the need for more aggressive tightening in the future.
From a fiscal policy perspective, we don’t see any meaningful incremental, stimulative spending (also known as deficit spending) coming down the pike. President Joe Biden’s approval rating is around 40% in several polls, and 70% of the country believes we are headed in the wrong direction. Moreover, a president’s party historically loses seats in both the Senate and the House during midterm elections. So, the Democrats could very well lose the thin margins they currently hold, creating gridlock in Washington until at least the 2024 presidential election.
So, who will be the winners and losers? Going forward, we expect those who perform critical analysis to prevail … and that hasn’t been the case in recent years. Day traders are currently getting crushed on the speculative investments they’ve made over the past few years in meme stocks, cryptocurrencies, SPACs and IPOs, and some of them have even amplified those losses using margin and leveraged trades. Likewise, passive investors are getting blindsided and probably thinking they’ll simply bounce off of another stimulus safety net. But, professional traders and skilled investors are enjoying the spotlight ─ protecting capital during the pullback and getting ready to pounce once compelling opportunities present themselves.
Inflation: From transient to trouble
We believe inflation has moved from being transient to being trouble. Stagflation is a recession, but with high inflation ─ a truly horrendous environment. There’s no doubt that the risk of recession or stagflation has increased significantly in recent months ─ leading to some tough decisions ahead for policymakers.
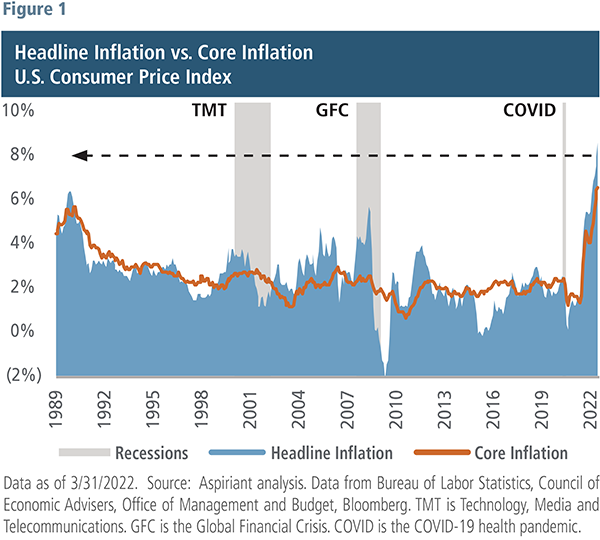
Figure 1 plots the year-over-year percentage change in Headline Consumer Price Inflation (CPI) going back to 1989. The blue area is the annual percentage increase in the price of a basket of goods and services. For example, as of March, the year-over-year increase in goods and services was 8.8%. The orange line measures Core CPI, which excludes food and energy since they are the most volatile components of inflation. As a result, you can see the orange line is a bit more stable than the blue area.
As shown, inflation by either measure is currently experiencing the fastest increase since the 1980s. It’s running well above the Fed’s target of 2%-2.5% by a factor of roughly four times, and it’s wreaking havoc on those among us who are living paycheck-to-paycheck.
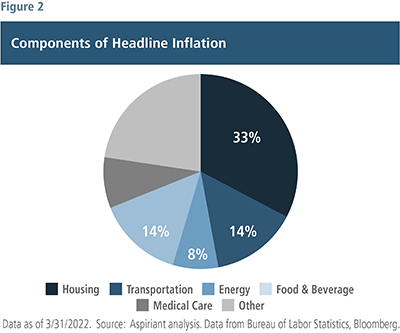
Figure 2 helps emphasize how bad things have become for those with little disposable income. To make a point, we can define essentials as housing, transportation, energy and food, which are the basics a person needs on a daily basis for survival. Those four blue components represent approximately 70% of headline inflation.
Nearly two-thirds of Americans self-identify as living paycheck-to-paycheck. That’s clearly enough voters to sway any election. And, since essentials represent over 60% of a person’s overall spending, it’s extremely difficult for many to absorb the 18% cumulative price increase in those components over the past two years.
Now that we have high inflation, the question becomes what can be done about it. Inflation stems from an imbalance between supply and demand, or alternatively, output and spending. And the remedy is to close that mismatch by boosting output, lowering spending or both. Output is commonly measured by GDP.
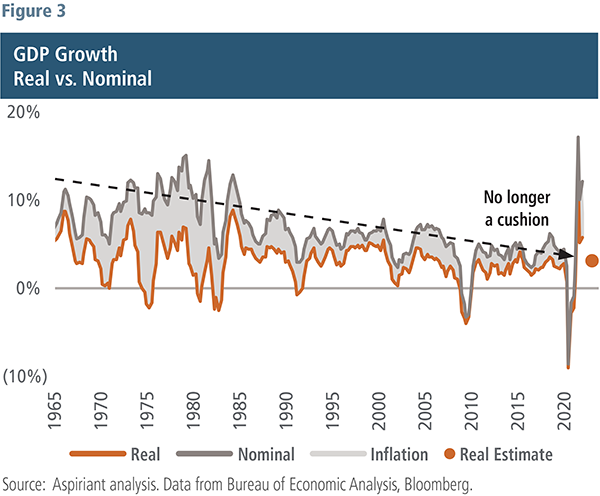
Figure 3 shows nominal GDP growth and real (inflation-adjusted) GDP growth. The difference between those two measures, inflation, is gray. Over the past 60 years, both nominal and real GDP growth have trended down. And the recent, above-trend gains in 2021 are expected to reset 2% to 3% over the course of this year and next, in line with the growth we experienced in much of the post-GFC period. You may rightfully ask, “Why can’t we do better than that?”
Well, output growth is a function of gains in worker productivity and employment. Improvements in worker productivity, through the adoption of new technologies and processes, allow the economy to grow as workers produce more goods or services per hour worked. For most of the past 20 years, average annual productivity has expanded between 0% and 1%. While we did see some upward movement in productivity recently, it is still not likely to be a source of much output growth.
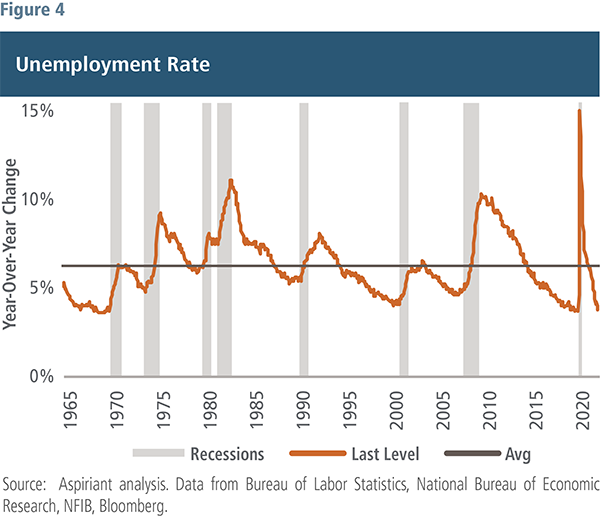
That leaves us with employment growth to try to boost output and shrink the spending gap. The unemployment rate, or the number of unemployed workers relative to the overall labor pool, is one indicator of potential slack in the labor market. Not surprisingly, unemployment spikes around recessions and serves as the spring for post-recession recoveries as workers return to work and increase output (Figure 4). The dislocation from the pandemic, when the unemployment rate peaked at 14.7%, is behind us. Unemployment now rests at 3.6%, a level near or at its lowest rate over the past 60 years, and very much in line with pre-COVID. The tight labor market is reflected in record job openings (at 7% of the labor force) and about half of small businesses reporting an inability to fill open positions.
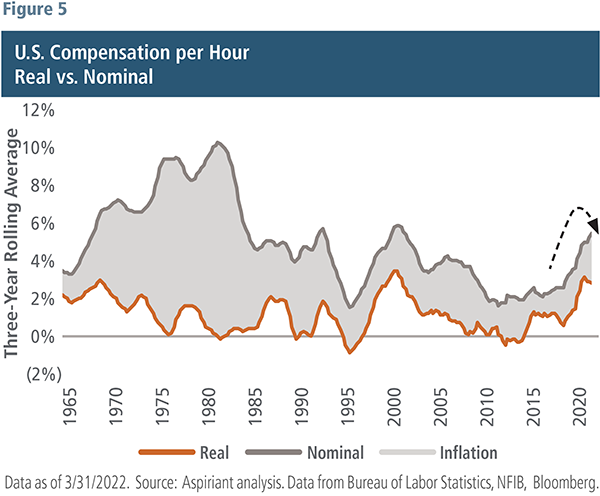
Additionally, wage growth (Figure 5) is at its highest level in decades as companies pay more to attract and retain talent. Like productivity, expanding employment beyond a percent or so is a tall order and, therefore, makes 2% growth in real output about the upper bound for the economy going forward.
With real output increases constrained around 2%, let’s move to the other side of the ledger: spending. For better and (possibly) worse, spending can be attacked on multiple fronts, and this is precisely where policymakers are taking aim. Spending is financed through credit, money and income. By changing those variables, you can change spending in the economy. Higher interest rates make credit less attractive, and that leads to lower spending since consumers use credit to buy a whole host of things, like homes, cars and business equipment. Money contraction, through the purchase of U.S. Treasurys by private participants or raising bank reserve requirements, takes dollars out of the economy that could otherwise be spent or used to finance spending. And lower incomes, through the elimination of excess government transfers and potentially job losses, are an outgrowth of tightening fiscal policy and possibly weaker economic conditions (the latter of which policymakers would like to avoid).
The likely policy response to high inflation and, more specifically, high spending will be multi-dimensional. Interest rates, both short- and long-term, will be the main instruments by which the Fed tries to achieve its objectives.
The Fed’s first action to boost interest rates was a quarter-point hike in the Fed Funds rate in March. It raised the rate again May 4 to 0.75%-1%. The market now expects the Fed Funds rate to increase to 2.75%-3% by year-end and peak at around 3.5% in the first half of 2023. The Fed has also signaled its intention to reduce its $9 trillion balance sheet of U.S. Treasurys and mortgage-backed securities at a clip of $95 billion a month. With the Fed not reinvesting the proceeds of its maturing securities back into markets, private participants will have to use their cash to soak up that lost demand, and presumably at higher long-term interest rates as an inducement to do so.
As the Fed manages interest rates, it will try to forestall an inversion, where short-term interest rates are higher than long-term interest rates. Why? An inverted yield curve further reduces the availability of credit as bank profitability declines since they typically borrow short and lend or invest long. Additionally, an inverted yield curve is often a precursor to a recession and can further dampen risk-taking by investors. Therefore, an inverted yield curve would suggest that the probability of the Fed reaching its dual mandate of price stability and full employment may be low.
Nonetheless, the intent is to use interest rates to reign in credit and consumption, narrow the mismatch between spending and output, and pull down inflation ─ all without imperiling the economy and employment.
Bonds: The dancing bears
It’s true that bonds tend to struggle during the initial phases of rate-hiking cycles. However, stocks, and especially expensive growth stocks, tend to perform even worse.
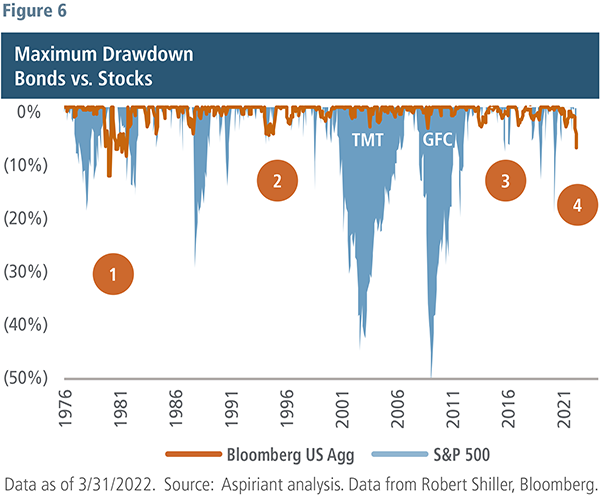
Figure 6 plots the loss investors experienced in the S&P 500 Index going back to the late-1970’s. During the Technology, Media and Telecommunications (TMT) bubble, the S&P 500 lost 46% and took seven years for investors to recover their account balances in real terms. During the GFC, the S&P 500 lost 57% and took five years to recover. We believe that recovery only occurred due to the trillions of dollars in stimulus injected into the economy and financial markets beginning in March 2009. Without it, the pullback would have likely been even worse and lasted longer.
The orange line on the chart shows the drawdown of bonds over the same period. The circles mark four rate-hiking cycles. As you can see, bonds did indeed sell off during each of those four periods. By comparison, the pullbacks were far less severe than they were for stocks around the same time, and the recovery periods were also much shorter. So, bonds tend to offer relative stability, even during turbulent times.
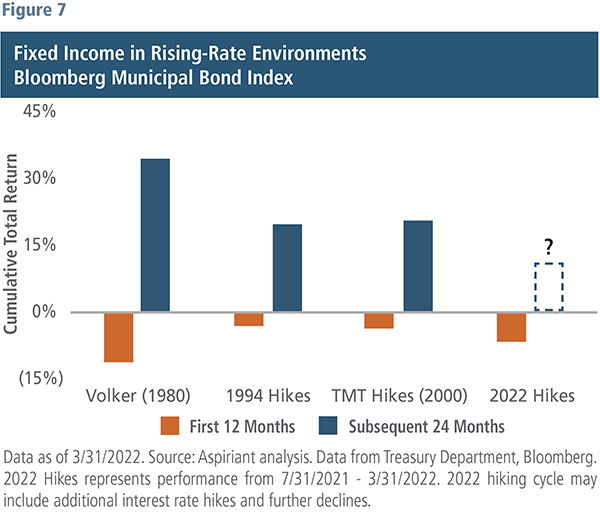
In fact, bonds more than recovered those losses over the two years following recent rate-hike cycles (Figure 7). We definitely don’t want to set an expectation that bonds are going to rally or produce double-digit returns over the next 24 months like they did in previous cycles. However, we do expect them to be positive contributors to portfolios and offer protection.
So why do bonds perform better when rates are higher? It breaks down to two simple reasons. First, when the yield curve shifts upward, a bond portfolio replaces its lower-coupon, maturing bonds with higher-coupon, longer bonds. That replacement causes the portfolio’s overall average yield to increase over time. Then, once the yield curve is higher, fixed income is likely relatively more attractive than equities. Today, our Capital Market Expectations for fixed income are higher than they are for most equities.
More return with less risk sounds pretty good to us, which is precisely why we’re comfortable holding a healthy allocation of bonds.
Diversifiers: The third ring
In a period like today, risk assets are broadly sensitive to higher interest rates. We have seen that with both bond and stock market indexes being down 10% or more this year. In this environment, we believe holding exposures that are less sensitive to the fluctuations, especially drawdowns, of traditional markets is critically important. These diversifying exposures tend to be strategies that have roughly equal amounts of long (meaning they benefit from upward price movements) and short (meaning they benefit from downward price movements) allocations and profit when the long positions outperform the short ones.
Gold, a timeless store of value, is another diversifying strategy as it has little correlation to the movements in stock markets and is viewed as a safe haven in times of distress.
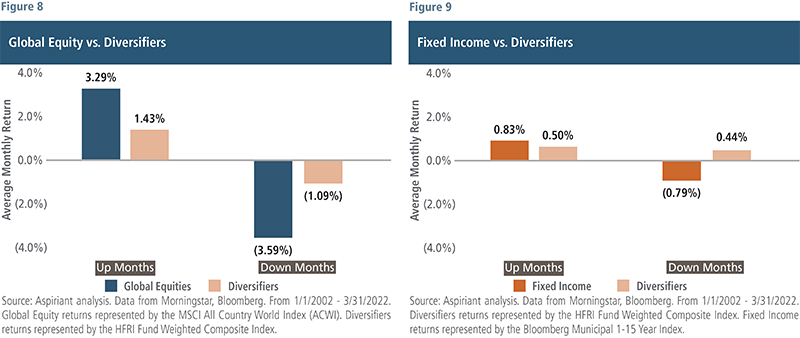
Figure 8 shows the performance of diversifiers against global equities. In up months, diversifiers do not keep pace with equities, capturing less than half of that appreciation. But they do so with much less volatility and generating risk-adjusted returns that are relatively quite attractive. In down months, diversifiers really show their mettle, posting losses that are 30% or so of global equities.
Figure 9 replicates the same comparison but with fixed income instead of global equities. As with equities, diversifiers do not match fixed income returns in up months, capturing only 60%. But importantly, in down months, diversifiers average positive performance. This result is especially valuable when you consider many investors view fixed income as the safe money in their portfolio.
Be prepared for the unusual
We’re moving from a period where policymakers were intensely focused on restoring economic growth by using lower interest rates and massive government stimulus to keep spending aloft. They met that objective, perhaps too well. Output, due to COVID and other reasons, did not track with spending, resulting in inflation we haven’t seen in over three decades. The most recent year-over-year reading for headline CPI was 8.5%, and excluding food and energy, it registered 6.5%. These price pressures are widespread and leave the less affluent most vulnerable to a loss of purchasing power. With mid-term elections approaching in the fall, it should not be surprising that politicians, as well as Fed officials, have spoken more forcefully about addressing this issue.
The cure for high inflation, in many ways, is a reversal of what worked so well in the past two years: higher short- and long-term interest rates, less liquidity through quantitative tightening, and a reduction in government spending. The challenge is bringing down inflation without steering the economy into a recession. Goldman Sachs economists have placed a 35% probability of a recession occurring over the next 24 months. Layer in the complexities and unknowns from COVID’s tenacity and the Ukraine/Russian war, and you can likely appreciate the steep test the Fed has in front of it.
Despite a wide range of outcomes ahead, we believe real economic growth will decelerate from 5.7% in 2021 to a rate consistent with pre-COVID levels. Inflation will plateau in the next few months then drift down, probably settling at something above target over the next year or two. We expect the markets will continue to be bumpy given the changing outlook for inflation, interest rates and growth. We also could see a more severe drawdown occurring if the Fed tightens too aggressively, economic growth turns negative, or risk-taking is cut substantially.
We never saw the exuberance of 2021 as being sustainable, and discipline is starting to pay off. Just look at any number of richly valued, popular growth stocks that have surrendered their pandemic gains over the past couple of quarters.
There’s a chance that the greed we’ve experienced for the better part of the past 12 years turns to fear. That could lead to price indiscriminate selling ─ when investors essentially sell everything and go into cash. At that point, financial assets could become cheap relative to their future cash flows.
As always, we believe investors should dynamically adjust asset allocations to take advantage of new opportunities as they emerge.
Important Disclosures
Aspiriant is an investment adviser registered with the Securities and Exchange Commission (SEC), which does not suggest a certain level of skill and training. Additional information regarding Aspiriant and its advisory practices can be obtained via the following link: https://aspiriant.com.
Investing in securities involves the risk of a partial or total loss of investment that an investor should be prepared to bear.
Any information provided herein does not constitute investment or tax advice and should not be construed as a promotion of advisory services.
The views and opinion expressed herein are those of Aspiriant’s portfolio management team as of the date of this article and may change at any time without prior notification. Any information provided herein does not constitute investment or tax advice and should not be construed as a promotion of advisory services.
Past performance is no guarantee of future performance. All investments can lose value. Indices are unmanaged and you cannot invest directly in an index. The volatility of any index may be materially different than that of a model. The charts and illustrations shown are for information purposes only. All information contained herein was sourced from independent third-party sources we believe are reliable, but the accuracy of such information is not guaranteed by Aspirant. Any statistical information in this article was obtained from publicly available market data (such as but not limited to data published by Bloomberg Finance L.P. and its affiliates), internal research and regulatory filings.
Bloomberg Barclays Municipal Index is a rules-based, market-value-weighted index engineered for the long-term tax-exempt bond market. The index has four main sectors: general obligation bonds, revenue bonds, insured bonds and pre-refunded bonds.
The S&P 500 is a market-capitalization weighted index that includes the 500 most widely held companies chosen with respect to market size, liquidity and industry.
MSCI ACWI Index is a free-float weighted equity index representing both domestic and emerging markets.
HFRI Fund of Funds Composite Index is a global, equal-weighted index of Fund of Funds that report to HFR Database. Constituents report monthly net of all fees performance in US Dollars and have a minimum of $50 million under management or a 12-month track record of active performance. Fund of Funds invest with multiple managers through funds or managed accounts. The strategy designs a diversified portfolio of managers with the objective of significantly lowering the risk (volatility) of investing with an individual manager.

 Talk to us


