Print this Insight.
At war with luck1
Gambling includes games of pure chance as well as those combining chance with skill. In games of pure chance — like roulette, baccarat and slot machines — the gambler plays against the house. The odds of winning are always stacked in the house’s favor, meaning the player is guaranteed to lose over the long-term. In the short-run, however, the gambler may go on a “lucky streak,” making money along the way. Nevertheless, it is mathematically certain that these streaks eventually come to an end. By contrast, in skill-based games — like Texas Hold ‘Em, Omaha and Seven-card Stud — the gambler plays against other opponents. While any player can win a hand or even a tournament, over the long run professional players tend to come out ahead.
Investing is a skill-based profession, requiring expertise, discipline, strategy and patience to prevail over the long term. No doubt there is an element of luck affecting all investors. Sometimes, investors experience “good luck” like the unprecedented bailout and support of financial assets both during and following the Global Financial Crisis (GFC). That’s akin to a pit boss announcing midway through a tournament that all players would have their bankrolls fully replenished, including those on the verge of being completely wiped out.
By introducing a flood of liquidity and easy money, central bankers essentially “changed the game,” saving average investors on the brink of disaster, but penalizing skilled investors who were on the verge of winning. Applying revisionist history, some investors spared during the GFC consider themselves smart and perhaps savvy. We consider them lucky. They nearly lost their entire fortunes because they lacked the expertise to assess the rising risks in the financial markets. Today, with their coffers chock full (thanks to the Fed!), we fear that the average investor is once again overplaying their hand — seemingly unaware of the present dangers.
Skill mitigates bad luck
Luck is unbiased, impacting all investors, whether novice or skilled, to one degree or another. Therefore, over time, the impact of luck washes out, neither favoring nor disfavoring any investor. So, the primary factor determining long-term results — success, failure or mediocrity — is skill. Judges and studies2 have found that skill matters most when it helps an investor avoid, or at least minimize, negative outcomes. Our Capital Market Expectations (CMEs) and financial market monitors (which we call, EKGs) are designed to do just that. These systematic tools help us rapidly and accurately assess forward investment return expectations for dozens of asset classes around the world. They enhance our discipline, making us more skilled than we once were.
Investing combines luck and skill
Games of random luck, like slots, appeal to those who want to be entertained, with no expectation of winning. By contrast, games of honed skill, like chess, appeal to those who want to be challenged, with every expectation of winning. Many consider games that combine both chance and skill, like poker and investing, to be the most interesting.
If investing were solely based on skill, the inexperienced wouldn’t invest because they would lose every time. Conversely, if it were solely based on luck, professional investors would quit. The combination of luck and skill allows any investor to win on any given day. However, over time, skillful investors prevail. Investors would be well-served by properly assessing the limitations of their skills.
“The best thing about poker is everyone thinks they can win.”
— Chris Moneymaker, Winner of the The World Series of Poker (2003)
Playing the percentages
Despite the additional skill we have developed, like all investors, we are bound to experience periods of underperformance. In the short run, bad luck can take a toll on even the most experienced among us. However, professional investors understand that situational investing is the key to long-term success. They analyze information to assess the probability of certain outcomes. Like counting cards, they attempt to quantify whether the odds are stacked for or against them.
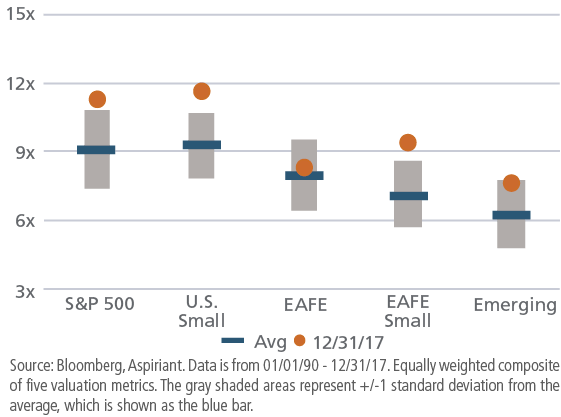
Asset Class Valuations
Current, Average and Historical Valuation Ranges

Take, for example, the preceding chart, which displays the current, average and historical valuation ranges3 of five broad equity asset classes. Unfortunately, none of these asset classes appears cheap. However, that doesn’t mean we can’t find some reasonably attractive opportunities. To the contrary, a savvy investor, playing the percentages, may very well recognize that since equities are richly valued, this is a better time to emphasize a healthy allocation to fixed income and defensive strategies.4 At the same time, the investor might limit their exposure to U.S. large caps, tilting the remaining allocation toward defensive equities.5 In addition, the investor may underweight or eliminate small caps in the U.S. as well as internationally. Next, the investor might very well overweight international large cap and emerging market equities since they appear to be within their normal valuation ranges.
Hot and cold streaks
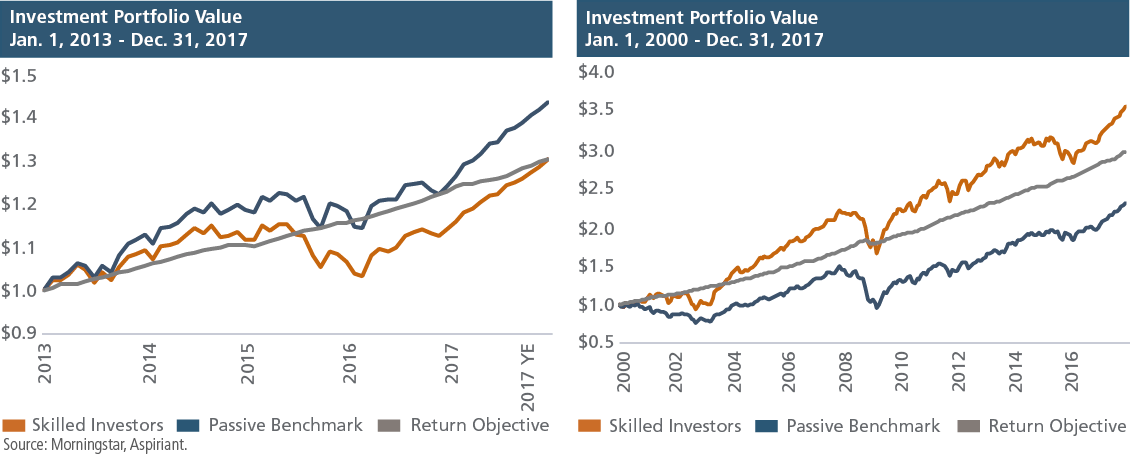
While sensible steps can increase the odds of winning, it takes time for skill to prove out. In the short run, luck may very well dominate. However, over the long run, talent generally prevails. The following charts help illustrate the point. They compare the performance of “skilled managers” to their passive benchmark6, as well as a real return objective of 4% per year. These are live track records of six different mutual funds managed by some of the most recognizable names in the investment industry — BlackRock, GMO, PIMCO, DFA, Goldman Sachs and JPMorgan — combined into one equally weighted composite.7

The chart on the left indicates that the skilled investors have underperformed their benchmark in recent years as valuations became further extended and markets marched higher. An impatient person might consider three to five years to be a sufficient period of time to gauge performance. However, when it comes to investing, this time window is too short to make any reliable judgments. Indeed, the chart on the right makes it abundantly clear that the skilled investors have well-outperformed their benchmarks over the long term, a period that importantly includes both rising and declining markets. In fact, $1 million invested with the skilled managers over the period would be worth $3.6 million (net of fees) today, besting the passive benchmark by $1.2 million.
Staying in the game8
In life (as in poker) remaining in the game is the primary objective. Doing so requires effectively managing an investment portfolio (bankroll) based on the opportunities presented by the financial markets (poker table). To illustrate the point, let’s suppose a couple decided to retire with a $5 million investment portfolio on January 1, 2000. To sustain their lifestyle, the couple plans to spend $300,000 per year. To help offset these required withdrawals, they would like to invest the portfolio with the hope of earning positive investment returns.
The couple considers two investment options: the S&P 500 and a passive portfolio.9 Before selecting one of their options, the couple reviews the trailing three-, five- and seven-year performance of each option to help inform their decision. Here’s what they find:

Question: Before reading further, which investment option would you select?
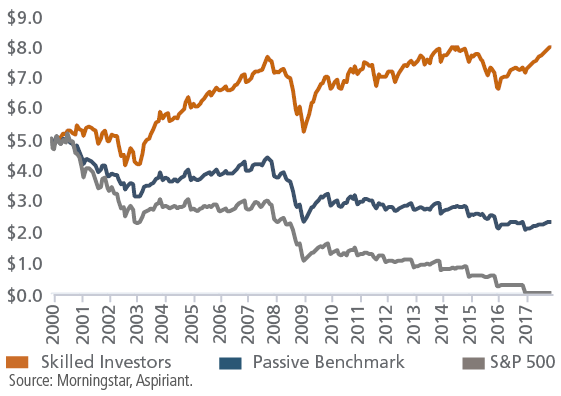
The following chart displays the outcome of three different scenarios. If our retirees selected the S&P 500, they would be flat broke in just 18 years. That result presents significant challenges if they happened to live longer. Even if the couple selected the passive benchmark they would be left with just $2.3 million over the period. However, by investing with our skilled managers (benchmarked against the passive benchmark6), the retirees would have fared much better. In fact, not only would their investment portfolio have supported their $300,000 in annual distributions, their portfolio would have actually grown to $8 million!
Investment Portfolio Comparison Assuming $300K Annual Withdrawals
Jan. 1, 2000 – Dec. 31, 2017

Two key takeaways from this example
- 1. Risk-taking must be intentional
Clearly, choosing the right managers matters — a lot. We selected this group because they are the exact same managers against whom we regularly compare our actual portfolio performance. Some readers might incorrectly assume the managers took a lot of risks to generate the favorable results. To the contrary, on average they took less risk than their benchmark during the period. However, the risk they took was intentional — increasing or decreasing as the landscape changed. - 2. Chasing performance is a losing strategy
Today, just like December 1999, many investors seem to be chasing performance — increasing U.S. equities simply because they have done well in recent years. Generally, asset classes that have recently performed well have likely outrun fair value. But, these investors often succumb to a fear of missing out10 and may very well find themselves surrounded by sharks all the more willing to welcome them.
Recognize the tells,11 interpret them well
Today, the market seems to be showing us a number of obvious “tells.” Our job is to properly interpret them, anticipate likely outcomes and position our portfolios accordingly. The table below presents five indicators we believe will have the greatest impact on portfolio returns over the next several years.
| Market Tells | Interpretation | Portfolio Move(s) |
|---|---|---|
| U.S. equity valuations sit well above historical averages. | Forward returns over the next several years are likely to materially lag the recent past as market volatility and/or interest rates (discount rates) return to more normal levels. | Seek opportunities outside the U.S. where valuations are closer to fair value and investors are better compensated for taking risk. |
| Profit margins hover near record levels. | Any combination of wage inflation, increased borrowing costs, global competitive pressures and a reversal in the business cycle are likely to pressure profits, slow earnings growth and further dampen expected equity returns. | Increase exposure to Defensive Equities (e.g. quality companies) that are better-positioned to protect their profits and, in turn, investor capital. |
| Interest rates have been pulled down to multi-generational lows by unprecedented amounts of central bank liquidity. | Fixed income securities’ interest rate sensitivity has increased and slightly reduced their ability to absorb adverse market moves. | Add strategies that broaden portfolio diversification, are less impacted by the oscillations of traditional markets, and complement fixed income as a second portfolio ballast (Diversifiers). |
| Inflation seems to have bottomed. | Deflationary effects (aging demographics, deleveraging, technological innovation, globalization) are likely to give way in the near term as global growth synchronizes, economies operate closer to productive capacity and late-stage fiscal stimulus (tax cuts, increased spending) takes root. | Selectively expand allocation to real assets as risks of rising price pressures accelerate. |
| Geopolitical risks, nationalism and wealth inequality are all on the rise. | Risk premiums embedded in financial assets may drift higher to reward investors for bearing these additional uncertainties. | Diligently monitor market conditions to capture new information and better calibrate risk taking with changing opportunities. |
Today, the market is priced to perfection, in other words, richly valued and unusually susceptible to new uncertainties or risks. That observation is so widely accepted12 that it’s really no longer noteworthy news. So, the question is what should a skilled investor do? We have already answered the question by taking deliberate steps to fortify the defensiveness in our portfolios. We are prepared, patiently awaiting a more inviting environment when we will finally go “all in.”
Footnotes:
1The phrase “at war with luck” is attributed to David Sklansky, a professional gambler and author.
2See, for example, studies conducted by the Global Poker Strategic Thinking Society, Levitt and Miles, and Cigital. See also the 2012 ruling by Federal District Court Judge Jack B. Weinstein.
3The composite is equally weighted across five valuation metrics, including price-to-earnings, price-to-sales, price-to-cash flow, price-to-book value and enterprise value-to-earnings before interest depreciate and taxes.
4Defensive strategies exhibit less sensitivity to movements in interest rates and inflation relative to traditional asset classes. They also tend to protect capital on the downside, acting as “dry powder” to purchase assets in the future.
5Defensive equities are residual interests in companies that over time outperform broad market indices by protecting capital in periods of market stress. High quality companies (that generate high and stable returns on equity with low leverage) and low or minimum volatility companies (with stock prices that tend to fluctuate less severely than the overall market) are often classified as defensive equities.
6The passive benchmark is represented by 60% MSCI ACWI GR plus 40% Bloomberg Barclays Municipal from 01/01/00 to 12/31/00; and 60% MSCI ACWI NR plus 40% Bloomberg Barclays Municipal from 01/01/01 to present.
7The “skilled managers” is an equally-weighted composite, consisting of up to six investment funds based on each fund’s inception date as follows: BlackRock Global Allocation Instl 02/03/89 – present; GMO Benchmark-Free Allocation (Class III: 7/23/03 – 12/10/12; Class IV: 12/11/12 – present); PIMCO All Asset All Authority 10/31/03 – present; DFA Global Allocation 60/40 I 12/24/03 – present; Goldman Sachs Dynamic Allocation Instl 01/5/10 – present; and JPMorgan Global Allocation I 05/31/11 – present.
8“Staying in the game” was inspired by Gavin Neil, CFA®, who works in Aspiriant’s wealth management practice.
9The passive portfolio is represented by 60% MSCI ACWI GR plus 40% Bloomberg Barclays Municipal from 01/01/1993 to 12/31/1999.
10For a broader discussion, please see our Foundational Elements: Speculator or Investor?, published December 5, 2017.
11A “tell” in poker is an unconscious change in a player’s behavior or demeanor that gives clues to opponents. An opponent may gain an advantage by properly recognizing and interpreting the player’s tell.
12A recent BofA Merrill Lynch Global Fund Manager Survey indicated the highest rating ever of participants citing “excessive” equity valuations.
Important disclosures:
Past performance is no guarantee of future performance. All investments can lose value. Indices are unmanaged and you cannot invest directly in an index. The volatility of any index may be materially different than that of a model.
Equities. The S&P 500 is a market-capitalization weighted index that includes the 500 most widely held companies chosen with respect to market size, liquidity and industry. The Russell 2000 Index measures the performance of the small-cap segment of the U.S. equity universe. It is a subset of the Russell 3000 Index representing approximately 10% of the total market capitalization of that index. It includes approximately 2000 of the smallest securities based on a combination of their market cap and current index membership. The MSCI EAFE Index (Europe, Australasia, and Far East) is a free float-adjusted market capitalization index that is designed to measure the equity market performance of developed markets, excluding the U.S. and Canada. The MSCI Emerging Markets Index is a free float-adjusted market capitalization index that is designed to measure equity market performance of emerging markets. The MSCI ACWI Index is a free float-adjusted market capitalization weighted index that is designed to measure the equity market performance of developed and emerging markets. The MSCI ACWI GR Index approximates the maximum possible reinvestment of regular cash distributions (cash dividends or capital repayments). The amount reinvested is the cash distributed to individuals resident in the country of the company, but does not include tax credits. The MSCI ACWI NR Index approximates the minimum possible reinvestment of regular cash distributions. Provided that the regular capital repayment is not subject to withholding tax, the reinvestment is free of withholding tax. Effective December 1, 2009, the regular cash dividend is reinvested after deduction of withholding tax by applying the maximum rate of the company’s country of incorporation applicable to institutional investors.
Fixed Income. The Barclays U.S. Aggregate Index represents securities that are SEC-registered, taxable and dollar denominated. The index covers the U.S. investment grade fixed rate bond market, with index components for government and corporate securities, mortgage pass-through securities and asset-backed securities. These major sectors are subdivided into more specific indices that are calculated and reported on a regular basis. The Barclays Municipal Bond Index is a rules-based, market-value-weighted index engineered for the long-term tax-exempt bond market. The index has four main sectors: general obligation bonds, revenue bonds, insured bonds and pre-refunded bonds. The Barclays High Yield Municipal Bond Index is an unmanaged index composed of municipal bonds rated below BBB/Baa.
Real Assets. The S&P GSCI® is a composite index of commodity sector returns representing an unleveraged, long-only investment in commodity futures that is broadly diversified across the spectrum of commodities. The returns are calculated on a fully collateralized basis with full reinvestment. Wilshire Global RESI is a broad measure of the performance of publicly traded global real estate securities, such as Real Estate Investment Trusts (REITs) and Real Estate Operating Companies (REOCs). The index is capitalization-weighted. The Alerian MLP Index is a gauge of large and mid-cap energy Master Limited Partnerships (MLPs). The float-adjusted, capitalization-weighted index includes 50 prominent companies and captures approximately 75% of the available market capitalization.

 Talk to us


