Talk to us
 Wealth Planning
The Financial Questions AI Employees Are Asking Behind Closed Doors


June 1, 2023

Uncertainty is high, and we encourage you to stay focused on the long term. The Fed currently finds itself in a tough situation: attempting to quickly knock out excessive inflation while simultaneously avoiding catastrophic side effects that could result from its actions. How this all plays out will largely influence what happens in the financial markets going forward.
The Fed’s Task and Toolbox
It’s good to recall that the Fed has a dual mandate. It attempts to set monetary policy in a way that ensures price stability, meaning low but stable price increases year over year. While its target level is 2%, inflation is currently around 5%. Simultaneously, the Fed attempts to support full employment. While there is no explicit target around that goal, most agree that the current level of unemployment at 3.5% is probably too tight of a labor market.
To pursue its dual mandate, the Fed uses a wide range of tools which typically fall under one of two approaches. When it wants to slow the economy and bring inflation back into balance, the Fed tightens monetary policy. To do so, it can increase short-term interest rates by increasing the Federal Funds Rate (the rate at which banks borrow from one another). The Fed also attempts to raise long-term interest rates by reducing (or tapering) the value of the securities it holds on its balance sheet (when bond prices go down, yields go up).
In March 2022, the Fed embarked on the steepest pace of interest rate increases in decades. The Fed’s rate hiking policy has been even more aggressive when you layer in the effects of quantitative tightening (QT). That means the Fed is reducing the size of its balance sheet, which saps financial liquidity from the system.
To knock out inflation, the first prong of the Fed’s dual mandate, it will have to raise interest rates and hold them high enough for long enough to reduce the demand for goods and services back closer to equilibrium. There are signs its policies are working, including cooling consumer and producer price increases, mixed commodities prices and cresting wages. But many effects are lagged and have yet to come through, including economic growth, housing costs, employment, corporate earnings and equity valuations. Throughout 2023 and 2024, we expect to begin seeing how these areas have been affected by rate hikes.
The employment picture, the second prong of the Fed’s dual mandate, is at the crux of what many people refer to when they talk about what kind of “landing” will likely occur. If we experience a soft landing, we’d expect to see core inflation fall back soon toward 2% with no material weakening in growth, profits, employment or wages and no material cracks in housing, debt/credit and equities. If instead we experience a hard landing; we’d expect unemployment to balloon from 3.5% to at least about 5.5% – meaning approximately three million people or more would lose their jobs. While a soft landing is still in the cards, we think the probability of a hard landing is more likely.
Unacceptable Levels of Inflation
In 2020, inflation initially began increasing due to the rising prices of goods – when people were buying cars, appliances, etc. – when some were using their COVID-19 stimulus checks to do so. The prices of goods during that time were further exacerbated by supply chain disruptions, the War in Ukraine, China’s shutdown, etc. More recently, inflation drivers relate to wage pressures, especially in the services industry, which reflect the tight labor market. But, as wage pressures have begun to cool in recent months, we’re confident that year-over-year inflationary pressures will continue to ease in the months ahead.
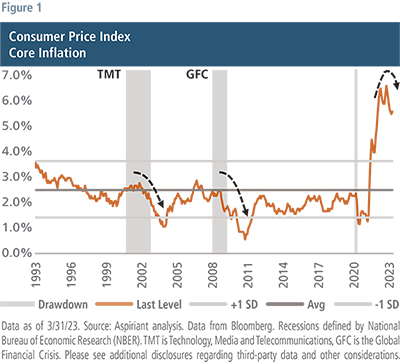 Figure 1 plots the Core level of Consumer Price Inflation, which strips out movements in energy and food, which can be more volatile. As you can see, inflation has indeed crested and appears to be turning downward. That’s largely related to the increasing level of interest rates being orchestrated by the Fed.
The big question is, where will inflation ultimately settle? Given the overall strength in the economy, we don’t see inflation settling at or below the Fed’s target of 2% anytime soon unless the Fed keeps monetary policy tight (meaning rates high) for a while.
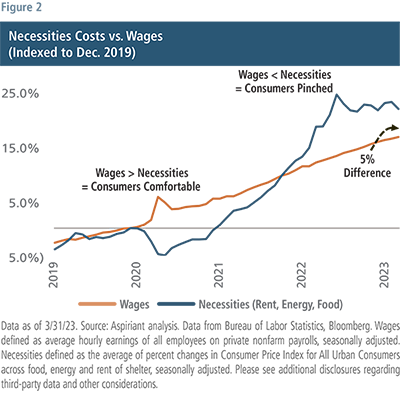 Up until late 2021 growth in wages, on balance, more than offset the increase in the cost of necessities. Therefore, consumers were feeling comfortable. However, that relationship flipped toward the end of 2021 as it started to become clear that we were all going to bear a costly toll for the massive — and arguably excessive — COVID-19 related stimulus programs. Since then, the cost of necessities has exceeded increases in wages, with the cumulative difference being about 5% today. In other words, consumers have about 5% less purchasing power today than they did pre-COVID. Simply put, they are falling behind.
And that’s especially true for the most vulnerable among us, many of whom are forced to make tough choices to make ends meet. For example, as we previously discussed, many turned to using credit cards despite average rates nearing 20%, which is the highest level in over 50 years including the hyper-inflationary period of the 1970s and 1980s. Others reduced their household savings, which currently sits near the lowest level (4.6%) in decades. Even more gut-wrenching is the increasing number of people who have had to reduce or even deplete their retirement savings to maintain their lifestyles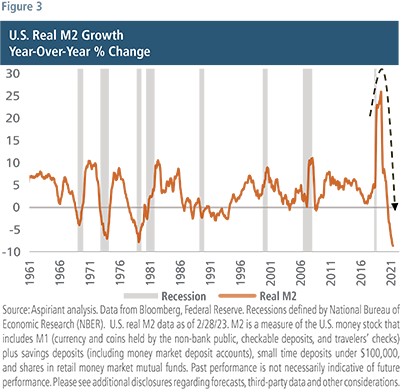 Figure 3 captures a broad measure of financial liquidity. It shows growth in the money supply or M2, which includes cash, checking deposits, savings accounts of less than $100 hundred thousand dollars, certificates of deposit and retail money market funds. COVID relief aid and government transfers caused M2 to grow by approximately 25% in 2021. Today, that same pool of money is shrinking by 8% annually. In fact, more than half of the $2 to $3 trillion dollars of excess savings amassed around the pandemic has been depleted. And J.P. Morgan expects the remainder to be depleted around the middle of this year.
As interest rates increase, the economy slows because it becomes more expensive not only for buying necessities, but also for goods, cars, computers, services, dining and taking vacations. At the same time, higher interest rates dissuade speculation, especially on lottery ticket-type investments such as meme stocks, cryptocurrencies, NFTs, IPOs and SPACs. While the most speculative ends of the market sold off dramatically in 2022, we believe we have yet to feel the full effects of the most severe tightening in decades.
Borrowing rates across the board have skyrocketed. Over the past 25 years, we’ve only had rates this high on two other occasions – the Technology Media and Telecommunications (TMT) implosion in the early 2000s when the S&P 500 sold off 46%, as well as during the Global Financial Crisis (GFC) in the later 2000s, when the S&P 500 sold off 57%. Between 2016 and 2018, the Fed increased rates by just over 2%. Even that half-hearted effort to normalize policy caused the taper tantrum with a 23% selloff in the S&P 500, leading the Fed to quickly pivot the following year. So, it’s worthwhile to ask, “what damage will the current rate hiking cycle cause?”
We believe the answer depends on how high and for how long the Fed will hold interest rates. Currently, the market and the Fed have different responses to those questions. Investors expect the Fed to pause (stop increasing rates) soon and then pivot (begin reducing rates) later this year. However, Fed members themselves expect to keep rates a bit higher for a bit longer than that. If the Fed sticks to its plan (and not the market’s expectations), then investors, businesses and consumers will all experience tighter credit conditions. In that case, we’d expect to see a significant selloff in U.S. equities. So, how bad could it be? How long could it last? And when should we increase risk by adding more equities to portfolios?
Although no one can precisely predict the future, we can better understand and anticipate how the future might unfold by studying similar environments. Let’s take a look at previous hiking cycles to attempt to frame what could be coming in the months and quarters ahead.
Figures 4 and 5 chronicle actual events that occurred during five previous rate-hiking cycles in which equities experienced a drawdown of at least 20%. The first rate-hiking period began in 1969, with the S&P 500 ultimately experiencing a drawdown of 36% (shown parenthetically). The second period began in 1973, with the S&P experiencing a drawdown of 43% and so on down the rows through 1981, 2000, 2006 and ending with 2022, which we believe is still ongoing.
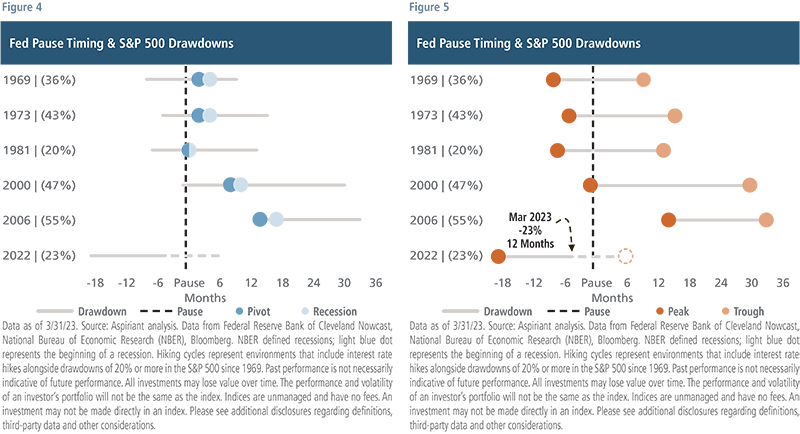
Each period shows the number of months during which drawdowns occurred both before and after the Fed paused rate hikes. The date of the pause is indicated by the vertical, dashed black line. For example, the peak of the 1969 cycle occurred about eight months before the Fed paused and the trough occurred about nine months after the pause.
On average, across all five cycles, the S&P 500 experienced a decline of 40% over a 21-month period. For reference, as of March 2023, the S&P 500 experienced its max drawdown of 23% in September 2022. Since then, the market has recovered by about 13% and is currently down about 10%.
Therefore, from where we are today, if we assume the future of the current environment resembles the average of the previous five events, we would expect the S&P 500 to fall another 30% over the next nine months. That would take it down to a level in the low-3000s, with its trough representing a 40% total decline in the S&P 500, perhaps around the early part of next year.
Notably, across all five periods:
So, without trying to get overly precise, we’re not at all surprised that the Fed has persisted thus far in raising rates closer to Core CPI. And we wouldn’t be surprised if it pauses soon, holds rates constant for a few to several months, then pivots around the time a recession begins, potentially toward the end of this year. The market trough could occur a handful of months thereafter. That’s precisely why we’re attempting to preserve as much capital as possible during downdrafts, giving us the opportunity to meaningfully compound client portfolios.
The S&P 500 advanced 7.5% during the first quarter of 2023, making U.S. equity appear strong, and masking many risks. Several anomalies that fueled the post-pandemic-market rally returned in the early months of the year, along with the January Effect. The most heavily shorted stocks and companies without profits advanced the most, and retail investors were active market participants once again. Notably, as was also the case in 2020 and 2021, market breadth was incredibly narrow.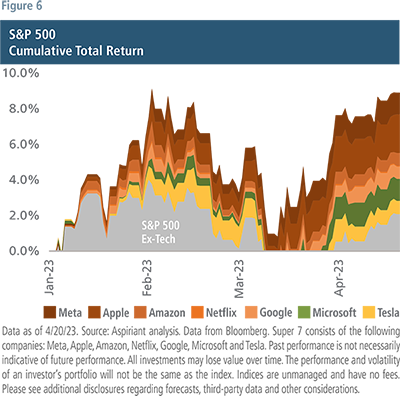
The Super Seven — Meta (Facebook), Apple, Amazon, Netflix, Google, Microsoft and Tesla —together have an aggregate market capitalization of $8.5 trillion dollars, account for about 25% of the S&P 500 index and were responsible for 75% of the S&P 500 gain in the first quarter of this year. Broadening out the lens a bit to isolate the 10 largest stocks in the S&P 500, those accounted for 90% of the first quarter advance. The other 490 stocks in the S&P 500 collectively returned 1% to 2%, depending on your point of reference. The Russell 2000 advanced less than 3%. So, for most listed stocks in the U.S., the quarter was not exceptional and mainly confined to movements in January.
A straightforward approach to estimate long-term equity returns is to simply take the earnings yield or the inverse of the Shiller PE, shown as the blue line in Figure 7. This is the prior 10-year average earnings, inflation adjusted of the S&P 500, relative to the total market capitalization of the S&P 500. As you can see, the blue line closely tracks the orange line, the 10-year forward annualized return of the S&P 500, for much of the past 100 years or so. Today, the Shiller earnings yield is around 3%, suggesting a roughly 3% annualized return over the next 10 years for the S&P 500, or an amount barely above long-term inflation expectations and well below the double-digit annualized returns experienced over the past 10 years.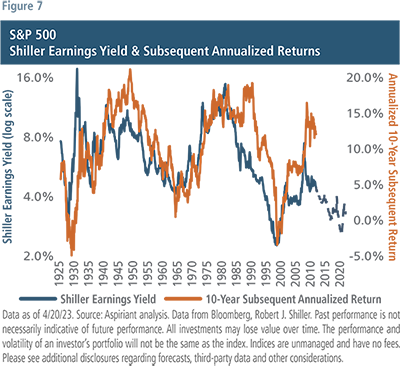
When we think about markets and economies being in balance, we consider three areas. First, is spending aligned with production? No, and that is why inflation is at multi-decade highs. Are incomes growing at the same rate as debt? Certainly not at the government level where U.S. debt to GDP has roughly doubled in the past 15 years. And finally, is there a risk premium or extra return available for investors for holding riskier assets? No, but with some exceptions.
In normal markets, bonds offer a return premium to cash and equities a return premium to bonds. For both the light and dark gray lines in Figure 8 that holds true. The difference being, the dark gray line reflects normal or fairly valued markets and the light gray line, with a steeper slope, represents a market with cheap valuations where the extra return is greater because of deep dislocations. Forward return estimates shown in light gray are measured in the depth of the global financial crisis in February of 2009. Today, we have the orange line in stark contrast to the other two lines. There seems to be no incentive to move out on the risk spectrum. Cash offers a return premium to bonds and bonds a return premium to equities. So, why hold equities at all?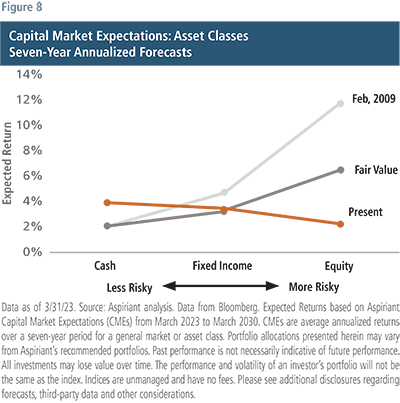
Digging deeper, we find pockets of opportunity and specifically equities that do provide a return premium to bonds and cash. Our analysis indicates international value stocks offer an additional 4% to 6% return above the broad equity forecast of 2% shown in Figure 8. Over seven years, that extra return is expected to generate 30% to 50% in cumulative outperformance. And, importantly, these exposures allow us to create a more normal risk line and build more balanced portfolios.
We believe the current environment, with more uncertainty and dispersion across and within asset classes, is a more favorable environment for active management than that of the past 10 to 15 years. We continue to construct portfolios expected to be resilient to a range of outcomes.
Overall, we hold a bit less risk in our portfolios than our benchmarks, given risks are skewed to the downside. We maintain healthy allocations to fixed income and believe it will be a better ballast to portfolios than in 2022, as we near the probable end of the Fed tightening cycle. We still like diversifiers (assets that don’t move in parallel with traditional markets) as the return outlook for them has also improved, and they can provide some extra protection for a variety of unknowns.
Within equities, we are overweight international and value stocks, and defensive equities (stocks of companies with more durable and stable profits) remain a key holding in our portfolios. Where appropriate, private market allocations can also serve to enhance returns by taking advantage of market dislocations and further broadening overall portfolio diversification.
During times of shifting economic and market conditions, like the one we’re in, remaining invested and focused on long-term financial objectives is the best action investors can take.


Disclosures
Aspirant is an investment adviser registered with the Securities and Exchange Commission (SEC), which does not suggest a certain level of skill and training. Additional information regarding Aspiriant and its advisory practices can be obtained via the following link: https://aspiriant.com.
Information contained herein is considered confidential, private and Aspiriant proprietary inside information that is intended only for the audience to which Aspiriant has knowingly distributed this presentation to, either by way of request or voluntarily. Any redistribution of this material without our prior express written permission is a violation of Aspirant’s privacy policy adopted to comport with various state and federal privacy laws that may subject any unauthorized distributor to legal action.
All opinions, figures, charts/graphs, estimates and data included in this document are as on date and are subject to change without notice. The statements contained herein may include statements of future expectations, for general market performance or economic conditions, and other forward-looking statements that are based on our current views and assumptions and involve known and unknown risks and uncertainties that could cause actual results, performance, or events to differ materially from those expressed or implied in such statements. Forecasts, projections and other forward-looking statements are based upon assumptions, current beliefs and expectations. Forward-looking statements are subject to numerous assumptions, estimates, risks and uncertainties, including but not limited to: economic, business, market and geopolitical conditions; U.S. and foreign regulatory developments relating to, among other things, financial institutions and markets, government oversight, fiscal and tax policy. Any forward-looking information should not be regarded as a representation by Aspiriant or any other person that estimates or expectations contemplated will be achieved, as the future is not predictable.
Past performance is not indicative of future results. There can be no assurances that any strategy will meet its investment objectives. All investments can lose value. The performance and volatility of an investor’s portfolio will not be the same as the index. Indices are unmanaged and have no fees. An investment may not be made directly in an index. The data used in this material was obtained from third-party sources the firm believes are reliable and internally. Aspiriant is not responsible for the accuracy of any third-party data used in the construction of this presentation. This information alone is not sufficient and should not be used for the development or implementation of an investment strategy. It should not be construed as investment advice to any party. Investing in securities, such as equity, fixed income and mutual funds, involves the risk of partial or complete loss of capital that prospective investors should be prepared to bear. Any reference to securities, directly or indirectly, is not a recommendation and does not represent a solicitation to buy or an offer of a solicitation to sell such securities. Any statistical information contained herein has been obtained from publicly available market data (such as, but not limited to, data published by Bloomberg Finance L.P. and its affiliates), internal research and regulatory filings.
Consumer Price Index (CPI) represents the changes in prices of all goods and services purchased for consumption by urban households.
Gross domestic product (GDP) measures the monetary value of final goods and services produced in a country in a given period of time. Real GDP represents the growth in GDP after adjusting for the impacts of inflation.
GFC is the Global Financial Crisis.
January Effect is the tendency for stock prices to rise in the first month of the year following a year-end sell-off for tax purposes.
Money supply (M2) includes cash, checking deposits, savings accounts of less than 100 hundred thousand dollars, certificates of deposit and retail money market funds.
Necessities defined as the average of percent changes in Consumer Price Index for All Urban Consumers across food, energy and rent of shelter, seasonally adjusted.
Russell 2000 is a small-cap U.S. stock market index that makes up the smallest 2,000 stocks in the Russell 3000 Index.
Super 7 consists of the following companies Meta, Apple, Amazon, Netflix, Google,
Microsoft and Tesla.
The S&P 500 is a market-capitalization weighted index that includes the 500 most widely held companies chosen with respect to market size, liquidity and industry.
TMT is Technology, Media and Telecommunications.
Wages defined as average hourly earnings of all employees on private nonfarm payrolls, seasonally adjusted.
Want the latest wealth management tips, investment insights and Aspiriant news delivered straight to your inbox. Sign up for regular Fathom updates so we can send you the most relevant content you selected below.