Part II: Approaching the limits of monetary and fiscal policy
The abundance of financial liquidity over the past several years has helped establish the longest-ever U.S. economic expansion. It has also driven higher-than-normal investment returns across virtually all asset classes, especially for U.S. equities. In fact, the S&P 500 has generated an annualized return of 16.8% from March 2009 to June 2019 as profit margins push near all-time highs and valuations approach a cyclical peak.
However, the country’s financial resources are neither unlimited nor easily replenished. In this Part II of our Second Quarter Insight, we discuss our growing concerns that the United States, like many other countries around the planet, may find itself constrained in the event of a prolonged and/or sharp economic downturn.
Limited monetary capacity
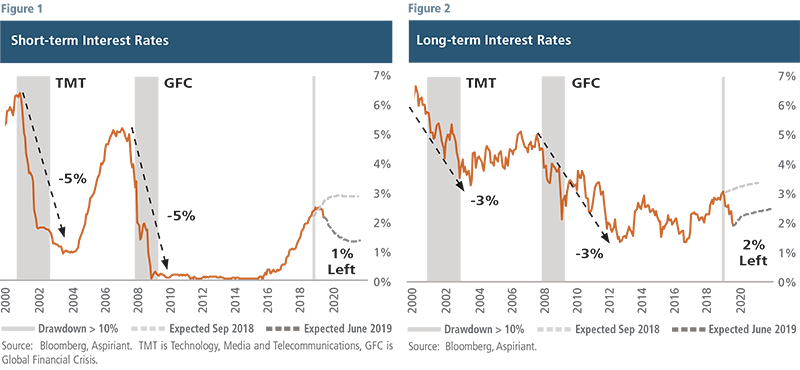
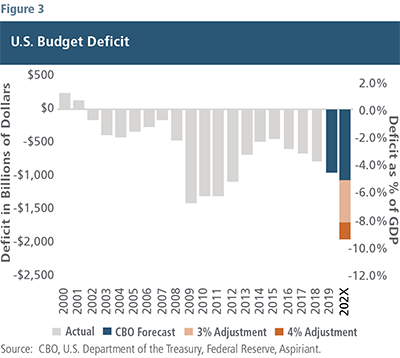
Although the U.S. Federal Reserve has a wider range of available monetary policy tools than other central banks, its capabilities are quickly diminishing. As shown in Figure 1, short-term interest rates are now expected1 to drop to approximately 1.3% over the next two years. That level is roughly 1.5% lower than the expectation as of September 2018. Conversely, long-term interest rates, as shown in Figure 2, are expected2 to be relatively flat at 2.5% over the next two years. Nevertheless, that interest rate target represents a decrease of approximately 1.0% versus expectations last September.

These lower expectations are already priced into today’s equity and bond valuations. As such, if the Fed cuts less aggressively, financial securities could experience a selloff. Alternatively, if the Fed supplies the rate cuts expected by the market, it would exhaust substantially its traditional monetary levers and have little ability to stimulate through lower rates when necessary in the future. Given these equally undesirable outcomes, the Fed seems squarely stuck between a rock and a hard place.
Rates down, wealth up — and vice versa
Lower interest rates allow consumers to borrow more, which enables them to spend more. And, since one person’s spending is another person’s income, jobs are created. More jobs lead to more spending and so on. As a result, lower interest rates generally provide economic benefits by enabling us to consume more goods and services than otherwise possible in a higher interest rate environment.
Lower interest rates also encourage companies to borrow more, which enables them to spend more. And, since one company’s spending is another company’s revenue, corporate earnings and equity valuations are buoyed. Consequently, lower interest rates tend to provide enhanced benefits for those who own financial assets versus those who do not, widening overall differences in individual wealth. Conversely, higher interest rates tend to result in increased costs for those who own financial assets compared to those who do not, which often narrows differences in individual wealth.
As we discuss in Part III of the Second Quarter 2019 Insight, widening differences in individual wealth may result in very different fiscal policies, depending on which political party gains influence in the 2020 elections.
Deficit spending
Like monetary policy, fiscal policy also encourages or discourages spending and investment, which affects economic growth as well as asset prices. Therefore, fiscal policy also influences whether differences in wealth among individuals widen or narrow.
But unlike monetary policy, both the benefits and costs of fiscal policy can be specifically targeted toward one group or another. And, since elected officials make those decisions, the outcomes tend to shift depending on which party controls the legislative apparatus.
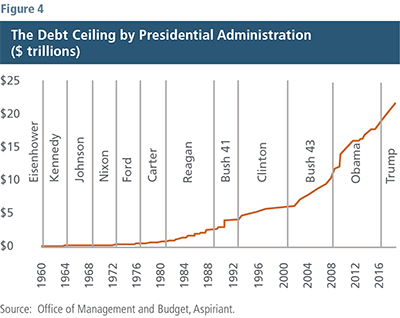
Policymakers also determine whether the benefits and costs will be apportioned to people today or in the future. For example, the benefits of fiscal deficits are typically enjoyed more by existing voters, older workers and retirees, while the costs are more heavily borne by younger citizens or future generations. On the other hand, the benefits and costs of fiscal surpluses typically have the opposite effect. As shown in Figure 3, the U.S. has consistently run fiscal deficits since the early 2000s. And, we ran massive deficits during the Global Financial Crisis (GFC), with the deficit exceeding $1 trillion in each of the four years between 2009 and 2012. Deficits came down as the economy regained its footing over the following few years, only to resume rising from 2016 onwards. Today, the Congressional Budget Office (CBO) forecasts the deficit to reach approximately $900 billion in 2019. Given this, one might reasonably conclude that our elected officials have been trying to please their current constituents at the expense of future generations.

The chart also shows a projection indicated by “202X.” That bar is intended to illustrate what could happen to the CBO’s projected deficit should a recession occur between 2020 and 2023. The 3% adjustment represents the average deficit increase as a percentage of gross domestic product, or GDP, actually experienced during previous recessions, excluding the GFC. In a sense, the adjustment represents the average amount of additional spending required by the government to dampen recessionary effects. The 4% adjustment is slightly more severe because it includes the GFC in the data set, when the deficit swelled by 8% to offset that larger contraction.
We’re not trying to be overly precise with these estimates. But if the scenarios are generally reasonable, our fiscal deficits could reach $1.5 trillion to $2.0 trillion per year in the next downturn.
One truly bipartisan issue
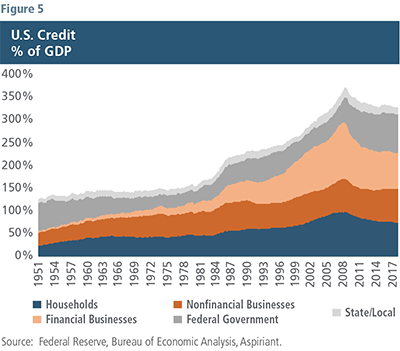
One area in U.S. politics that has long received bipartisan support is increasing the federal government’s maximum allowable debt. As shown in Figure 4, the so-called “debt ceiling” has been on an accelerating upward trend spanning at least 12 presidents and 16 presidential terms, irrespective of political party.

In fact, the president signed a new debt ceiling bill pushing up the annual allowable deficit to about $1.1 trillion through July 2021, thereby increasing the debt ceiling to over $24 trillion. We’re now poised to add a considerable amount of debt to the country’s already over-burdened balance sheet.
Today’s low and flat interest rates make servicing debt a bit more manageable. But, at some point, we’re still obligated to repay at least 100 cents for every dollar borrowed (absent a dip into negative interest rate territory prevailing in Europe and Japan). So, claims that ultra-low rates make debt repayment appreciably easier are generally overstated. At some point, the debts come due and the debtor must make good.
On a side note, we technically have two other options to cope with our mounting national debt. We can default on our debts by either delaying repayment or simply foregoing repayment. Alternatively, we can attempt to debase our currency by printing money, increasing inflation and diminishing the current value of the debt (which are also bonds held by investors: one person’s liabilities are another party’s assets). The challenge with either path is that of the $21.2 trillion in debt currently owed by the country,3 Americans (a.k.a. taxpayers/voters) directly or indirectly own $15.0 trillion, while non-U.S. investors hold the remaining $6.2 trillion. Accordingly, any lawmaker favoring default or debasement will likely find themselves on treacherous political ground.
MMT: When every other well runs dry
When interest rates are near all-time lows, central banks have a limited ability to resuscitate, sustain or accelerate economic growth. Given that reality, some U.S. economists and politicians have been promoting an alternative method of economic stimulus.
Modern Monetary Theory, or MMT, is a version of fiscal stimulus characterized by extreme fiscal spending with inflation contained by targeted taxation. The idea is that an economy, particularly one that controls its own currency, has the flexibility to run up massive debts to produce economic well-being for its citizens, especially during economic slowdowns. In a low-interest-rate environment, repayment of the debt is considered manageable. The primary problem with this approach is that rampant spending may ignite wildfire inflation. To douse the flames, the government would then (dramatically) increase tax rates to drain liquidity, and presumably run fiscal surpluses to repay some of the amassed debt.
Like other forms of fiscal policy, under MMT our elected officials would determine who receives the benefits (through spending) as well as who pays for it (through taxation). The big risk of this approach, then, arises from entrusting more power in the hands of our elected policymakers to make sensible, but potentially unpopular decisions.
Our mounting pile of debt
Unfortunately, it’s not just the federal government that spends more than it takes in. Households, businesses, and state and local governments also tend to spend more than they earn.
 Figure 5 shows as a country, our total debts are hovering around 350% of our GDP. Notably, these figures exclude massively underfunded entitlements that add considerably to this debt pile, such as Social Security, Medicare/Medicaid and state pensions. While aggregate debt is a bit less than the 380% level set during the GFC, it’s still incredibly high by historical standards. Moreover, we would have naturally expected the level of debt to decrease more meaningfully after a decade-long expansion period. If not now, then when?
Looking ahead, we appear determined to test the limits of the country’s debt capacity. At some point, perhaps in the not-too-distant future, we may find that limit. When that time comes, we’ll likely need to make some tough choices that may fundamentally alter our economic system.
Prudent portfolio positioning
Given the Fed’s limited available policy tools combined with our doubts policymakers will effectively cope with the challenges ahead, we continue to see downside risks outweighing upside opportunities. That said, there is a “soft-landing” scenario in which the combined effects of monetary and fiscal policy are enough to avoid a severe pullback in equities.
Therefore, we continue to be defensively positioned, tilting toward assets we believe will perform relatively well in a low-growth, low-rate, low-inflationary environment. However, we have not yet “maxed out” the defensiveness in our portfolios because we believe some reasonable opportunities still exist. And, we want to take advantage of them.
We intentionally position our portfolios to perform reasonably well, regardless of how the future unfolds. Therefore, we expect to safely grow our clients’ assets, patiently waiting for a more inviting environment.
1Expected short-term interest rates estimated by the futures markets for the June 2021 U.S. federal funds rate.
2Expected long-term interest rates estimated by the futures markets for the 10-year Treasury yield for Q4 2020.
3As of Fiscal Year 2018.
Important Disclosures
Aspiriant is an investment adviser registered with the Securities and Exchange Commission (SEC), which does not suggest a certain level of skill and training. Additional information regarding Aspiriant and its advisory practices can be obtained via the following link: https://aspiriant.com.
Investing in securities involves the risk of a partial or total loss of investment that an investor should be prepared to bear.
Any information provided herein does not constitute investment or tax advice and should not be construed as a promotion of advisory services.
The views and opinion expressed herein are those of Aspiriant’s portfolio management team as of the date of this article and may change at any time without prior notification. Any information provided herein does not constitute investment or tax advice and should not be construed as a promotion of advisory services.
Past performance is no guarantee of future performance. All investments can lose value. Indices are unmanaged and you cannot invest directly in an index. The volatility of any index may be materially different than that of a model. The charts and illustrations shown are for information purposes only. All information contained herein was sourced from independent third-party sources we believe are reliable, but the accuracy of such information is not guaranteed by Aspirant. Any statistical information in this article was obtained from publicly available market data (such as but not limited to data published by Bloomberg Finance L.P. and its affiliates), internal research and regulatory filings.
Equities. The S&P 500 is a market-capitalization weighted index that includes the 500 most widely held companies chosen with respect to market size, liquidity and industry.

 Talk to us


