
Part III: Differing and widening perspectives
For much of the past 30 years, government policy has been decidedly pro-business and therefore pro-markets.1 As a result, investment gains have significantly outpaced their long-term averages. Going forward, however, those tailwinds have died and are unlikely to contribute to future economic improvements or investment returns.
At the same time, equity valuations and profit margins are set to decline, and recession signals mount.2 In addition, monetary and fiscal policy options are largely depleted.3 As a result, political solutions are being discussed and debated to support employment, businesses and financial markets going forward. However, individual circumstances spotlight differing and widening perspectives on the health of the country, as well as the role of the federal government to address perceived disparities in wealth and opportunity. The disparities lead to vastly different proposed plans.4 In this Part III of the Second Quarter Insight, we recognize the causes behind the disparate perspectives, which is important to understanding how public policy is likely to evolve and the potential implications for investors.
Broad but not uniform improvements
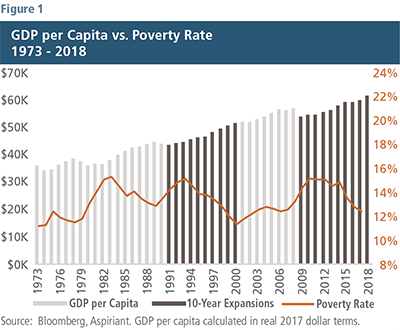
As shown in Figure 1, Americans have experienced a gradually rising standard of living as measured by gross domestic product (GDP) per capita, which measures the average amount of goods and services produced and consumed by our citizens. The gray shaded bars, adjusted for inflation,5 have generally increased over the past five decades. In fact, between 1973 and 2018, total GDP per capita increased more than 70%.
For most Americans, life has gotten better as well as easier over the years. Today, we collectively enjoy more and higher-quality goods (homes, automobiles, appliances, smartphones) and services (health care, education, travel and entertainment) than we ever have.
However, even after the longest economic expansion in our history, the “average” American has yet to reclaim the overall financial stability achieved before the Global Financial Crisis (GFC). For example, median annual household income, adjusted for inflation, has increased by just $2,900 in the nearly 20 years since 2000.6 Over the same period, the costs of essential services like housing, health care, childcare and education have ballooned, exposing the masses to greater vulnerability in the next downturn.7
At the same time, we have struggled to durably improve the lives of the most impoverished among us. Figure 1 also shows that the national poverty line8 has been range-bound between 12 and 16 people for every 100 citizens. Although poverty tends to decrease during expansionary periods, it has inexorably drifted back upward during economic pullbacks. As a result, despite five decades of growth, the overall trendline is flat, rather than decreasing, as might generally be expected.
Growing and sharing the pie
The cumulative net worth, or the value of all personal assets after deducting personal debts, of a country’s citizens provides another perspective on how the nation has grown and shared its economic pie. Figure 2 indicates that total net worth in the U.S. increased by $58 trillion between 1989 and 2018,9 representing an average annualized real growth rate of 3.1% after adjusting for inflation. That growth rate comfortably exceeds the cost of living, indicating the country has been enriched over the past three decades.
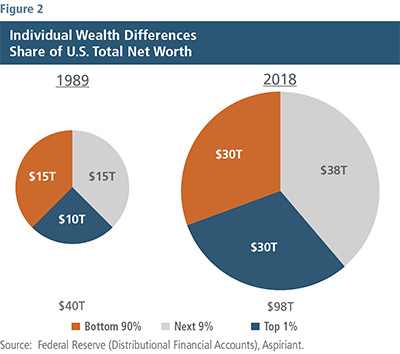
Almost everyone has benefited to one degree or another. However, while the Bottom 90% have seen their share double from $15 trillion to $30 trillion, the Top 1%’s share tripled from $10 trillion to $30 trillion. As a result, the two groups currently own equal shares of the country’s wealth. Said differently, one in 100 of us owns as much as 90 people in 100.
A primary factor contributing to this widening wealth differential relates to individual ownership of financial assets, including stocks, bonds and real estate. The Top 1% owns more of these assets, which tend to increase in value during periods of economic growth, falling interest rates and expansionary fiscal policies. On the flip side, they can also swiftly decrease in value during market dislocations. Sub-periods like the GFC serve as reminders of the impact severe pullbacks can have on financial assets.
Regardless, even though most of us have benefited, a few of us have benefited more and in some cases, substantially more. As the gap in economic experiences broadens, the likelihood of different constituencies forming disparate policy prescription rises and leads to a splintering in opinion about how — and to whom — the country’s resources should be allocated. Over time, that intensifying divide upends the composition of our elected officials, as voters naturally elect lawmakers that share their own views and promise to address their concerns.
Galvanizing divides
There are roughly 15 months remaining between now and the 2020 elections. Although plenty of time exists for the presidential and congressional candidates to change their views, policy divisions appear to be appreciably wider than in prior election cycles. A primary reason for the deepening political divide is that the parties, and more specifically the views of the most fervent members within each of them, are pulling candidates further apart. So, despite both parties purportedly welcoming all perspectives, each has retreated to more partisan positions. As a result, moderate politicians, who have historically linked the parties together, now find themselves increasingly isolated and cast adrift.
As shown in Figure 3, congressional party-line votes hovered around two-thirds of the votes cast prior to the 1980s. Since then, party-line votes have steadily surged, irrespective of the political party of the president. More recently, party line votes reached 90% or more on each side of the aisle. It is interesting to note political polarization began to intensify in the 1980s, around the same time that differences in wealth began to accelerate.
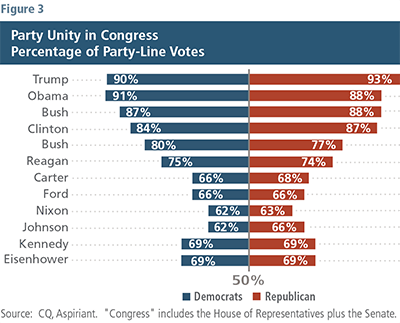
For example, the Tax Cuts and Jobs Act, which dropped the corporate tax rate from 35% to 21% among other provisions, passed both chambers of Congress without a single vote from a Democratic representative or senator. The most consequential legislation in President Donald Trump’s first year of office was passed exclusively on a party-line vote. Similarly, the Affordable Care Act, arguably President Barack Obama’s most historic legislative achievement, shared the same fate. No member of the Republican party crossed over and voted in favor of it.
Generational shifts
Each new generation of Americans possesses an ability to affect the overall direction of the country. This stands to reason because as more young people reach voting age, they shape election results and skew outcomes consistent with their values and beliefs. Since societal shifts often lead to policy changes, it behooves long-term investors to attempt to anticipate these shifts before they occur.
To that end, let’s examine the impact millennials are beginning to have on the political landscape in the country. The term “millennials” applies to Americans born between 1981 and 1996, meaning they range in age from 23 to 38. The millennials number 72 million and are the second largest demographic cohort after the baby boomers, many of whom are their parents.
As shown in Figure 4, millennials had high birth rates. Plus, they have attained the highest average level of education of any age group in our country’s history. Population and education levels are key inputs to economic growth. As people progress through their careers, they earn higher levels of aggregate income and pay higher amounts of income taxes. Oddly, the correlation between education and earnings may not hold true for millennials.
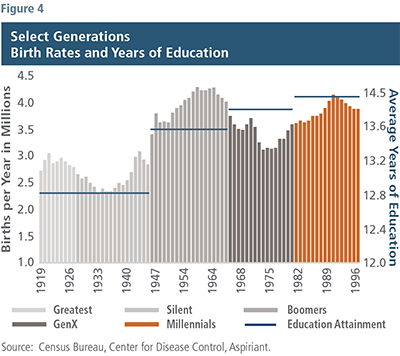
A partial explanation for the breakdown in millennial career advancement may be because many of them were in their most formative years — middle school, high school, college or just beginning their careers — during the depths of the GFC. While virtually every American was impacted by the financial collapse, millennials faced a particularly stressful and challenging job market. Although the overall unemployment rate crested at 10% in the last recession, the unemployment rate for 20- to 24-year-olds peaked at 17%. Unlike mid-career job gaps, one that occurs at the onset of one’s career is a vexing predicament that can inflict lasting damage as job skills are neither accrued consistently nor at a measured clip. As a result, even a decade later, millennials have generated lower earnings and accumulated less wealth compared to every other generation since the Great Depression.10
Therefore, they are much more likely to live longer at home with their parents, and delay home ownership, marriage and children. In fact, this generation has driven down the number of U.S. births to its lowest level in 32 years, which will likely affect future economic growth, including funding for social programs like Social Security.
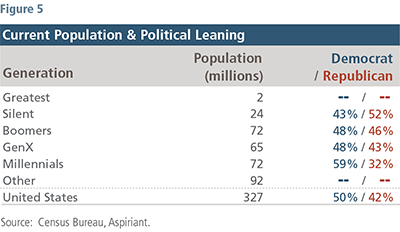
Since, on average, millennials are having a harder time achieving a comfortable middle-class lifestyle, many seek additional federal assistance to help cover essential needs including education and health care. As shown in Figure 5, their collective views on the role of government have resulted in a noticeable shift in those who self-identify politically as leaning left.
Political implications for investors
As things sit today, we’re assigning a roughly two-thirds probability that we’ll have divided government after the elections next fall. In that case, we’d expect a contentious and polarized government unlikely to enact dramatically different policies than those currently in place. In that scenario we would expect an investment environment characterized by low and choppy returns as industries and investors await clarity on policy implications.
On the other hand, there’s a one-in-three chance that one political party claims unified control. Depending on which party prevails, we would expect vastly different policies and, therefore, different implications for both industry and investors.
Given the breadth of these outcomes, our portfolios are defensively positioned and well-diversified. As such, we expect to contain the impacts of any severe selloffs while sensibly growing our client portfolios, irrespective of the prevailing policy regime.
1Examples of business- and market-friendly policies relate to: globalization and optimized supply chains, lower tariffs and corporate taxes, persistently declining interest rates, lighter regulations, falling union participation and collective bargaining rights, abundant liquidity, and a steady drop in transaction costs.
2For a broader discussion, see our Q2 2019 Insight, Part I.
3For a broader discussion, see our Q2 2019 Insight, Part II.
4To ameliorate these divisions, policy leaders in the U.S. and abroad have proposed several initiatives, ranging from higher tariffs and restructured economic relationships to the establishment of wealth taxes and corporate tax surcharges.
5GDP per capita adjusted for inflation using constant 2017 dollars.
6Source: Census Bureau, Sentier Research Household Income Trends.
7Please see our Q4 2018 Insight for a broader discussion about the health of the American consumer.
8Source: Bloomberg, the Census Bureau. Poverty status is determined by comparing pre-tax cash income against a threshold that is set at approximately three times the cost of a minimum food diet as determined by the Department of Agriculture. The threshold, originally created in 1964, adjusts based on family size and is updated annually for inflation using the Consumer Price Index.
9Source: Federal Reserve (Distributional Financial Accounts).
10Source: Pew Research, Federal Reserve, Young Invincibles.
Important Disclosures
Aspiriant is an investment adviser registered with the Securities and Exchange Commission (SEC), which does not suggest a certain level of skill and training. Additional information regarding Aspiriant and its advisory practices can be obtained via the following link: https://aspiriant.com.
Investing in securities involves the risk of a partial or total loss of investment that an investor should be prepared to bear.
Any information provided herein does not constitute investment or tax advice and should not be construed as a promotion of advisory services.
The views and opinion expressed herein are those of Aspiriant’s portfolio management team as of the date of this article and may change at any time without prior notification. Any information provided herein does not constitute investment or tax advice and should not be construed as a promotion of advisory services.
Past performance is no guarantee of future performance. All investments can lose value. Indices are unmanaged and you cannot invest directly in an index. The volatility of any index may be materially different than that of a model. The charts and illustrations shown are for information purposes only. All information contained herein was sourced from independent third-party sources we believe are reliable, but the accuracy of such information is not guaranteed by Aspirant. Any statistical information in this article was obtained from publicly available market data (such as but not limited to data published by Bloomberg Finance L.P. and its affiliates), internal research and regulatory filings.

 Talk to us


