
IS&R Highlights
- The economy is warming while financial markets begin to cool.
- Neither the Fed nor Congress is positioned to provide much more stimulus.
- Recent market volatility has largely impacted riskier, speculative investments.
- Expect the Fed to err on the side of being a bit late in its tightening.
- As inflation concerns grow, this is not the time for portfolios to look like the market.
- We still see opportunities and strategies that take advantage of the ugly, particularly in value stocks, international companies, defensive equities and defensive strategies.
Avalanche Warning?
As if we didn’t have enough to worry about with Omicron, we are also facing worrisome inflation, rising interest rates, and the resurgence of volatility in the stock market. 2021 was a year for risk-taking, with meme stocks and moonshots, NFTs and SPACs dominating headlines. But it was also an unusually calm year, with an intra-year drawdown of only 5%, the second smallest drop in the last 25 years.
While 2021 was the year for risk-taking, 2022 thus far has investors re-evaluating their risk appetites and suddenly focusing on price and valuation. The S&P 500 has already experienced a correction (a drawdown of at least 10%) in the first 26 days of the year. The resurgence in volatility hasn’t taken us by surprise, especially in the areas of the market that have been most impacted, namely growth stocks, meme stocks, cryptocurrencies, initial public offerings (IPOs) and special purpose acquisition companies (SPACs). We’ve also identified the use of short-dated call options and margin as forms of leverage amplifying the mounting risks.
Although it is a bit too early to sound an avalanche warning, market volatility is becoming evident in pockets of risky assets. We continue to believe we are moving into a different environment, away from a low interest rate and muted inflation landscape to one of rising rates, stickier inflation and reduced risk appetite.
Although the word avalanche invokes fear, we are not implying an impending collapse in asset values across the board. Rather, many of the unloved areas of the market like value stocks, international companies, defensive equities and defensive strategies may finally have their day in the sun.
On the surface, conditions appear stable
The Omicron variant has caused the highest spikes we’ve seen thus far in terms of new and active case counts. But, thankfully, while hospitalizations and deaths are increasing, they haven’t risen nearly as fast. And although the rate of new infections has been quite high, the increase is already slowing. So we’re starting to see business and personal lifestyles return to something near pre-pandemic.
Thankfully, due to the heroic efforts of our medical professionals, biotechnologists, and frontline and essential workers, Covid-19 appears on a path to becoming endemic. Meaning, it is likely to be another illness with which we must cope and live, but the immediate crisis should pass over the course of time as infections, hospitalizations and deaths all stabilize. We are not saying all’s clear with respect to Covid-19. Sadly, the stark reality is the pandemic will continue to take its toll on our health and lives going forward. But consensus is growing that — barring any new problematic variants — the rate of infections, hospitalizations and deaths should stabilize.
At the same time, we’ve seen the economy begin to stabilize, with Gross Domestic Product (GDP) at $23.2 trillion, which is back to its pre-Covid 19 trendline. Demand for goods and services is outpacing supply, driving us toward full employment, but also pushing inflation upward for seemingly everything from goods and services to wages, housing and assets. We’ve all seen and felt it — namely $5 gas and $6 lattes.
Below the surface, a hollowing may be underfoot.
To us, the investment landscape looks chock full of risks: record-setting equity valuations, negative (real) bond yields, cryptocurrencies, short-dated call options, over-the-counter (OTC) trades, SPACs and IPOs, especially for companies with negative earnings.
Recent price action is really a function of three connected inputs: inflation, interest rates and risk premiums. A risk premium is the additional expected return or compensation, relative to cash, for holding risky assets.
At the end of 2020, inflation, as measured by the Consumer Price Index (CPI), was 1.4%. Excluding food and energy, known as core CPI, it was 1.6%. At the end of 2021, CPI was 7.0% and core CPI was 5.5%. Recall that as prices started to rise, the Federal Reserve initially communicated it felt these readings were transitory, or temporary. Turns out they appear stickier than anticipated, causing the Fed to accelerate its timeline for raising short-term interest rates and ending its asset purchases or quantitative easing. At the end of 2020, just one year ago, investors expected zero rate hikes by the end of 2023. Today, the market, depending on the day, is pricing in six to eight quarter-point interest rate hikes. And finally, the extra return demanded by investors for holding risky assets has started edging higher. Credit spreads for high yield debt have increased since the start of the year, as has our estimate of the equity risk premium.
Inflation’s continued rise has prompted a corresponding upswing in interest rate expectations and a slight increase in risk premiums. And since the price of any stock is the discounted present value of all future cash flows, higher interest rates and risk premiums make those future cash flows less valuable — the more distant the cash flows, the greater the impact or reduction in present value. Not surprisingly, the effects of higher interest rates and risk premiums are most acutely felt in the riskiest securities — specifically, companies with high valuation multiples and unproven business models. While these effects are visible in the public markets, we fully expect to see them extend into the private markets as well.
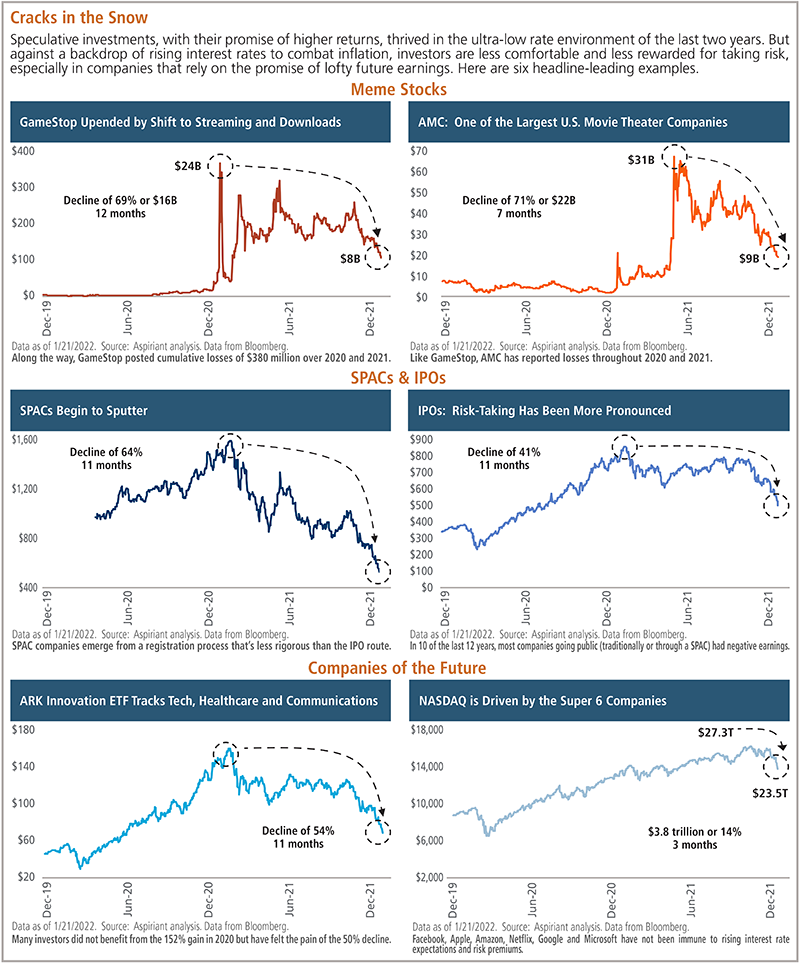
Broad selloffs are worsened by margin
In the early stages of a pullback, investors tend to sell their riskiest investments first. That’s especially true for investors who got in toward the tail end of a speculative frenzy. It’s just not any fun to lose your money fast, especially when you were coaxed into making the investment by friends who claim to have gotten rich — at least on paper and at least for a while. For those last few holdouts who eventually succumb to the fear of missing out, or FOMO, entering the game late and losing quickly can feel like you were bamboozled.
But, as a decline worsens, investors begin selling other positions, including ones they thought were good.
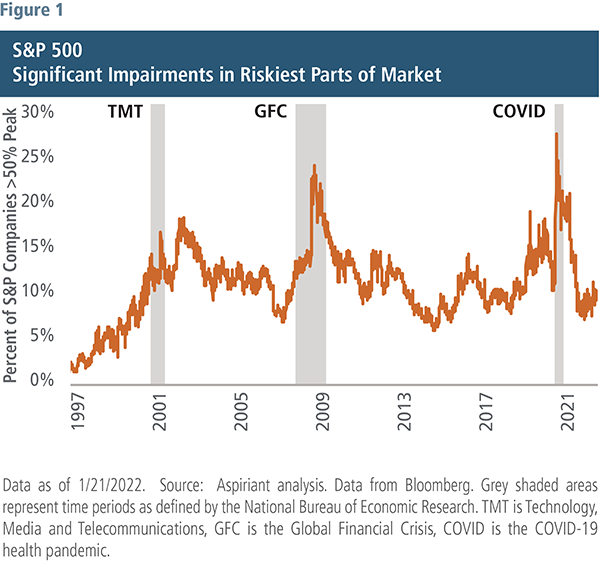
Figure 1 shows the percentage of the 500 companies in the S&P 500 that had lost at least half their value relative to their respective peak prices. The breadth of selloffs tends to widen as the line jumps upward. So, we first start taking a beating in the riskiest portions of our portfolios. Then, we start taking a beating from every other direction, as indicated by the gray shaded areas. That should stand to reason as severe losses of 50% or more in an ever-growing number of stocks almost certainly means that investors are experiencing losses in other companies, but perhaps not as severely.
Another reason sell-offs ensnare more companies as they worsen relates to the use of margin. Clearly, investors’ appetite for margin has increased over time. That’s largely because the cost of margin has dropped along with the decrease in prevailing interest rates.
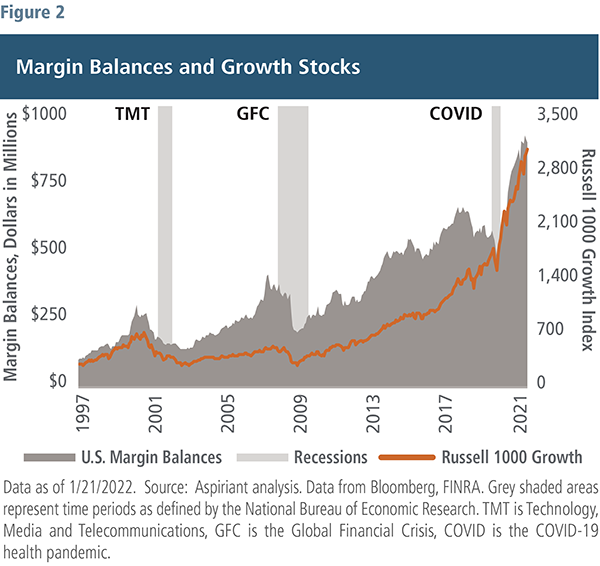
In Figure 2, the orange line plots the total return of U.S. large-cap growth stocks. As you let your eyes zoom out a bit, you can clearly see margin balances tend to increase as the price of growth stocks increase. But they also decrease when growth stocks fall, as shown concurrent with the Technology, Media and Telecommunications (TMT), Global Financial Crisis (GFC) and Covid drawdowns. Said differently, leverage amplifies outcomes in both up and down markets. And, during severe pullbacks, investors are often forced to sell even their good investments to satisfy the liquidity terms of their margin accounts.
Stock slides could snowball into housing
Easy policies prompt risk-taking when it comes to buying our homes, equities, bonds, commodities, or virtually any type of speculative asset. The problem is each housing peak (Figure 3) came sliding down around the same time equities and other assets began their pullbacks. It’s like being caught in multiple avalanches all at once. Just when we’re losing trillions of dollars in our stock portfolios, we’re also losing trillions in our home values, and we’re probably not doing well with other investments, too.
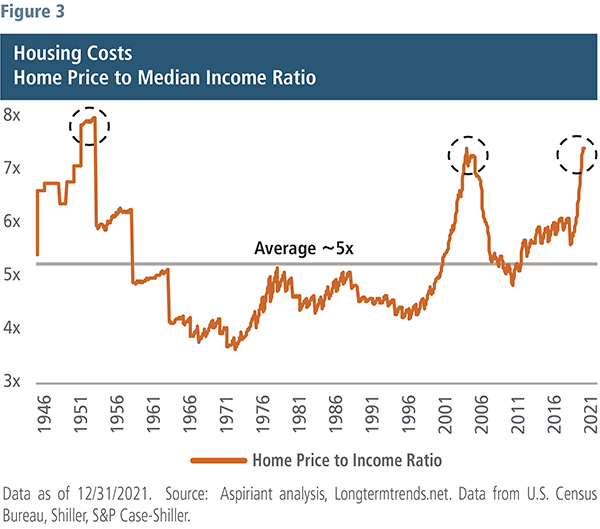
And, if you think it’s only the marginal buyer who would fall victim to such a slide, think again. Whereas those with lower credit ratings who likely had fewer financial resources were outbidding each other for their primary residences prior to the GFC, those with higher credit ratings (and likely more assets) have been outbidding each other for their first, second or even third homes more recently. That’s possibly because they have felt richer as their portfolios increased in value. But you have to ask yourself, what happens when things go the other way?
Our concern is if the slide in equities and other risky assets continues, we could see spillover into housing. In that environment, many investors could discover that they aren’t as well off as they thought they were.
Monetary policy: The Fed prepares to shift
In its January 26 statement, the Fed expressed concern about the toll inflation is taking, especially on the most vulnerable families. So it is expected to begin raising rates in March, with a total of three or four increases in 2022, and another three or four in 2023. Unless the markets experience a severe pullback, we expect the Fed to make good on those expectations.
As the Fed pivots to shift its approach and tighten monetary policy, it is faced with an unpleasant reality. It can do much more to slow the economy — through interest rate hikes and quantitative tightening or selling its securities portfolio — than it can do to ease or stimulate should economic activity decline.
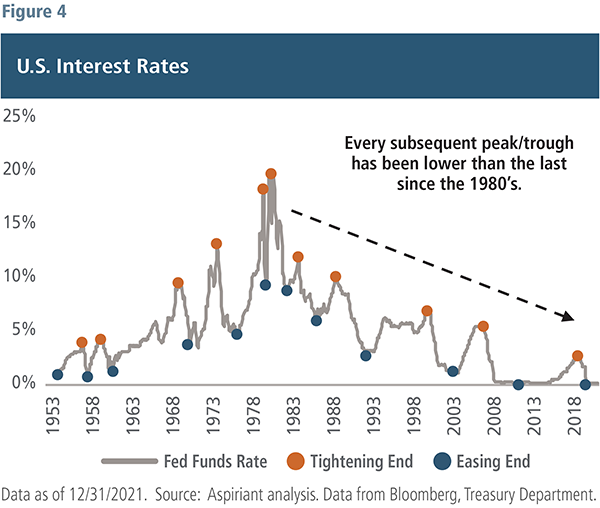
Figure 4 shows the federal funds rate, which is the interest rate banks lend their excess reserves to one another on an overnight basis. Every tightening cycle since the early 1980’s has resulted in a lower peak fed funds rate. And similarly, every easing cycle has ended in a lower rate. If history holds, it’s likely the Fed ends this tightening cycle at a level that is at or below the last tightening cycle of 2015 to 2018, when it could only raise its policy rate to roughly 2.25%. When confronting a recession, the Fed, has had to cut the rate, on average, by five percentage points to sufficiently encourage new borrowing and spending and get the economy moving again.
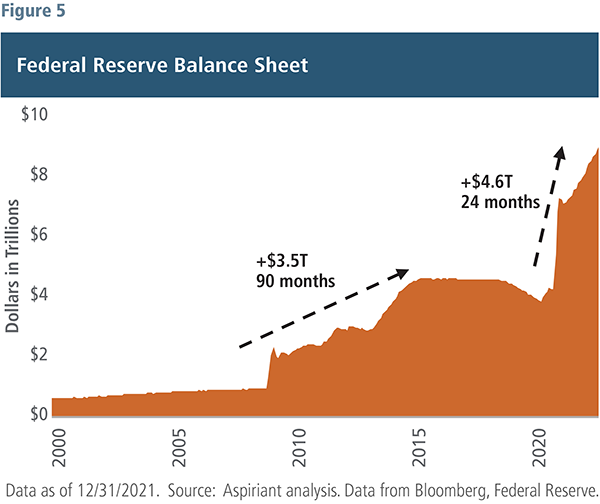
Of course, Fed asset purchases have ballooned again since the onset of the pandemic, as shown in Figure 5. In less than two years, the Fed has purchased an amount of financial assets that is $1 trillion greater than during and after the GFC, and over a much shorter time frame. Stopping or reversing that flow of liquidity is, at best, neutral to financial asset prices. The last time the Fed stopped buying assets following the GFC in October 2014, the stock and bond markets were muted, up low single digits, annualized, over the subsequent two years. And recall that the reduction of the Fed balance sheet, which began in March 2016, along with multiple interest rate hikes in 2018 were factors helping precipitate the almost 20% drawdown in the S&P 500 in the fourth quarter of 2018.
So, the Fed can do quite a bit to curtail economic growth and halt the rise of inflation, and in the process, impair financial asset returns. Conversely, with rates already low and likely to stay low, and valuations across financial assets high, even with the recent selloff, the ability of the Fed to navigate an economic downturn is quite limited. Given that asymmetry, we expect Fed policy to lag economic conditions and err on the side of being a bit late in its tightening rather than being too aggressive and risk a recession. But, as we saw in early 2019, the Fed could once again pivot and not increase rates and resume the previous pace of bond buying.
Fiscal policy: Stimulus is drying up
An often overlooked part of the market recovery over the past two years has been U.S. fiscal policy. Without question, the economy and financial markets would have been in a very different place without the series of COVID relief packages that tallied roughly $5.5 trillion. The U.S. budget deficit for 2020 amounted to 15% of GDP and 17% for 2021. The Office of Management and Budget (OMB) forecasts a budget deficit of $2 trillion or 8% of GDP for 2022. That change in spending from 17% to 8% of GDP results in a sizable fiscal tightening, as fewer dollars are directed into the economy, and will be a drag on growth.
At the same time government spending is falling, Democrats are still interested in raising taxes on corporations to fund their policy initiatives. The Build Back Better proposal contemplated a global minimum corporate tax rate, expense limitations, an excise tax on share repurchases, and price curbs on drug pricing. Corporate taxes have been an increasingly smaller share of U.S. government receipts, even more so following the passage of the Tax Cuts and Jobs Act in 2017. So for equity markets, fiscal policy could exert a negative effect of slowing economic growth and higher corporate taxes and other regulations.
Senate Democrats continue to have difficulty passing the administration’s most substantive legislation. The Build Back Better plan lacks support from Sen. Joe Manchin (D-WV). Moreover, Democrats could lose control of the Senate, and possibly the House too, in the 2022 midterm elections. If that occurs, a divided Congress will likely result in gridlock — making additional spending or stimulus very unlikely until after the 2024 presidential election.
Yes, there is a chance the Democrats will try to pass pieces of Build Back Better so the fiscal tightening is not as severe. But the appetite for any new legislation lessens as we approach the mid-term elections in the fall. Secondly, moderates like Sen. Manchin may be be even less agreeable to new spending given our debt levels. Should any legislation pass, it will likely be largely funded or revenue neutral with marginal stimulative effects.
3 potential scenarios
As aspects of fiscal and monetary policy remain uncertain, let’s walk through three broad scenarios that could play out going forward.
1. Tight monetary and tight fiscal policies
Our first case is that the Fed begins its tightening path, fiscal policy tightens as well, and no new spending programs are passed. In this scenario, the monetary and fiscal tightening is offset by strong private market activity (household and business spending), and the economy slows back toward pre-pandemic levels, stabilizing from there. Inflation comes down as supply catches up to demand, and bottlenecks from the pandemic wane. Asset prices suffer, particularly in the most speculative areas, with further declines dependent on how interest rate expectations and risk premiums change from what is discounted into markets today.
We see value stocks gaining at the expense of growth stocks, and cash and bonds helping to preserve capital, on a relative basis.
2. Looser monetary or fiscal policy, but not both
Our next scenario is less severe: monetary or fiscal tightening that is not as sharp as the first case. In the near-term, the Fed appears pretty committed to tightening, so we could envision some moderation in fiscal tightening with some limited new spending programs. For example, the U.S. Innovation and Competition Act has already passed the Senate on a bipartisan basis. It provides over $250 billion in new funding for basic and advanced technology research over a five-year period. And certain elements of Build Back Better, such as climate change and universal pre-K programs, may get traction as separate, stand-alone bills. But under no circumstance can we envision fiscal spending that even remotely compares to 2020 and 2021 levels. Nevertheless, in this case, economic growth is a bit better, inflation is likely to be higher (relative to the first case) and financial markets are a bit more oscillating.
Value still likely outperforms growth, and cash and bonds offer capital preservation benefits, but less so on a real or inflation-adjusted basis. Quality stocks, with the ability to pass along price increases, are also a favored exposure. And real assets could have some benefit in this scenario.
3. Less severe tightening for both
Our final scenario is one where tightening by both the Fed and government is less severe than the first case. For this to occur, the Fed would have to pivot or hit the off ramp in its interest rate hikes. We would expect it to do this if equity market losses were so significant that it raised concerns about consumer behavior and spending, or if growth slowed to a stall speed of 1% or less. The real dilemma for the Fed would be if this transpired at the same time inflation was elevated, causing it to choose between price stability and full employment. We suspect the later would win out as it is harder to deal with a falling economy than rising inflation.
Either way, we would expect to see some resumption in speculative activity and a recovery in growth stocks, at the expense of value stocks. And quality stocks, given the durability of their cash flows and business models, should hold up fairly well. Should this scenario lead to stagflation (low growth and high inflation) real assets could also have a role here too.
Survey the landscape
Notwithstanding the recent market pullback as well as potential for trouble ahead, we believe opportunities exist for those who understand how to survey the investment landscape.
Our Capital Market Expectations (CMEs) represent the average annualized returns we expect passive index investors to earn over the next seven to 10 years. As prices go up, our future return expectations tend to come down. So, it should be no surprise that as prices (especially for growth stocks) have shot upward since March 2020, our forecasts have been dropping lower and lower. In fact, as of December, our forecasts indicated investing in many asset classes — especially growth stocks and U.S. large-cap stocks — could actually generate portfolio losses over the next seven years.
However, even when our forecasts paint an ugly picture, like they currently do, we can still find opportunities to protect and even make money using strategies that take advantage of ugly. The two following charts illustrate how we’re able to see such opportunities when others can’t.
The bars in Figure 6 show the difference between our value stock and growth stock forecasts across five asset classes. So, the blue bar for U.S. large caps is the difference between our forecast for U.S. large value stocks minus our forecast for U.S. large growth stocks. Although neither of those underlying forecasts is inviting today, we believe strategies that go long U.S. large value and short U.S. large growth could generate an average annualized return of about 11% over the next seven years. That would more than double an investor’s capital over the period.
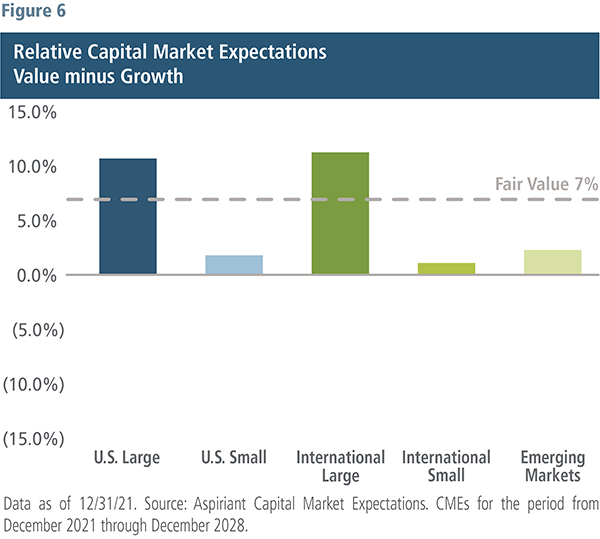
The opportunity could be similar for long international large value and short international large growth. The relative forecast there is about 12% annualized. The other three bars show additional opportunities exist to be long value and short growth in U.S. small caps, international small caps and emerging markets. So, the differential of value versus growth is clearly a global phenomenon — one we believe exists due to the trillions of dollars of stimulus that’s been injected into economies and markets by governments around the world, which has prodded risk-taking and speculation.
In the absence of stimulative supports, we believe public equities should generate an average annualized return of about 7%. Since we believe passive equity indexes are all overvalued today, none of our forecasts are at or above 7%. However, to reiterate, by having an ability to go long value and short growth, especially in large caps, we think investors can generate positive returns in that portion of their portfolios.
Figure 7 compares our forecasts of value and growth equities to municipal bonds. For each pair of forecasts, value equities minus munis is on the left-hand side and growth minus munis is on the right-hand side.
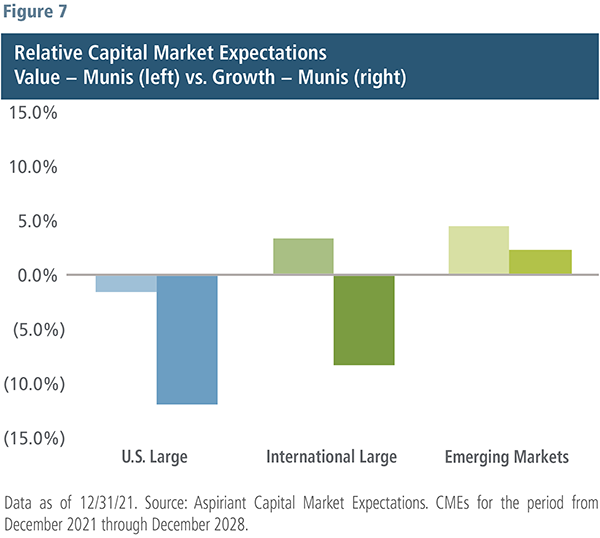
Our forecast for U.S. large value minus municipal bonds is pretty similar — producing a result close to 0%. That’s obviously not great for value equities. For investors with considerable taxable gains in their value stocks, we wouldn’t necessarily advise selling them to buy munis. It may not make sense after taxes.
However, that may not be the case for broad-based U.S. large growth stocks minus municipal bonds. We expect munis to dramatically outperform, possibly clobber, U.S. large growth stocks over the next seven years … just like they have in other severe pullbacks. So, growth stocks are expensive not only relative to value stocks, but also compared to less risky and more tax-efficient municipal bonds. And we expect both emerging market value and growth stocks to outperform munis over the next seven years.
It’s been difficult to be a disciplined, valuation-conscious investor the past few years while risk-taking in speculative investments pulled in new investors. However, building and sustaining wealth over the long term is often more about avoiding the avalanches. Investors can make a lot of money on the backside of an avalanche, as long as you’re prepared going into the slide and also have the ability to recognize and take advantage of emerging opportunities.
Important Disclosures
Aspiriant is an investment adviser registered with the Securities and Exchange Commission (SEC), which does not suggest a certain level of skill and training. Additional information regarding Aspiriant and its advisory practices can be obtained via the following link: https://aspiriant.com.
Investing in securities involves the risk of a partial or total loss of investment that an investor should be prepared to bear.
Any information provided herein does not constitute investment or tax advice and should not be construed as a promotion of advisory services.
The views and opinion expressed herein are those of Aspiriant’s portfolio management team as of the date of this article and may change at any time without prior notification. Any information provided herein does not constitute investment or tax advice and should not be construed as a promotion of advisory services.
Past performance is no guarantee of future performance. All investments can lose value. Indices are unmanaged and you cannot invest directly in an index. The volatility of any index may be materially different than that of a model. The charts and illustrations shown are for information purposes only. All information contained herein was sourced from independent third-party sources we believe are reliable, but the accuracy of such information is not guaranteed by Aspirant. Any statistical information in this article was obtained from publicly available market data (such as but not limited to data published by Bloomberg Finance L.P. and its affiliates), internal research and regulatory filings.
Bloomberg Barclays Municipal Index is a rules-based, market-value-weighted index engineered for the long-term tax-exempt bond market. The index has four main sectors: general obligation bonds, revenue bonds, insured bonds and pre-refunded bonds.
The S&P 500 is a market-capitalization weighted index that includes the 500 most widely held companies chosen with respect to market size, liquidity and industry.
The DE-SPAC Index is a rules-based index developed to capture the performance of a group of 25 companies that became public as the result of a business combination with a Special Purpose Acquisition Company (SPAC).
The Renaissance IPO Index is a diverse portfolio of US-listed newly public securities that provides exposure to securities under-represented in broad benchmark indices. IPOs that pass a formulated screening process are weighted by float, capped at 10% and removed after two years.
Nasdaq Composite Index is a broad-based capitalization weighted index of over 3,000 stocks listed on the Nasdaq stock exchange.
The Russell 1000 Growth represents the companies in the Russell 1000 universe with higher price-to-book ratios and higher forecasted growth ratios.
The Russell 1000 Value represents the companies in the Russell 1000 universe with lower price-to-book ratios and lower forecasted growth ratios.

 Talk to us


