Last quarter, we argued that skillful investors, like professional gamblers, generally come out ahead. One important reason is their ability to remain in the game, and ultimately, in the profession. A challenge to achieving that goal is staving off unnecessary risk-taking, especially following a prolonged winning streak.
This Insight builds on the discussion, identifying two of the most lethal risks afflicting investors today: equity exposure and margin. We further describe how two investing legends view each.
Limited outs, then drawing dead
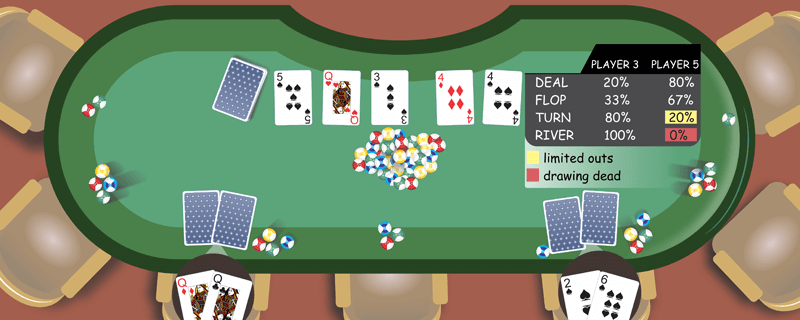
A poker player is said to have “limited outs” when the odds of winning are heavily stacked against them. In that scenario, typically only a few cards remain in the deck that would help the player prevail. When the deck contains no more outs (useful cards), the player is said to be “drawing dead.” At that point, they have no chance of winning, regardless of what cards come up next. Since the player cannot see their opponents’ cards, they are typically in the unenviable position of being unaware that they are guaranteed to lose. So long as their opponent remains in the game, refusing to be bluffed into folding, the doomed player will face mounting losses, while their opponent rakes in the spoils.
As long-term investors, our primary goal is to remain in the game — giving ourselves as many opportunities to win as reasonably possible by intentionally avoiding extensive losses when drawing dead. To help us achieve that goal, we have developed forecasting and monitoring systems1 designed to accurately assess changing probabilities. Like skilled poker players who reassess the odds every time a card is played, we recalibrate probabilities whenever new information is gained.2 We are not trying to predict precisely what will happen in the near-term. To the contrary, we are simply trying to understand directionally how things will unfold over the next market cycle. Our process is akin to meticulously counting cards and recognizing and interpreting tells to grind out attractive long-term results.

Figure 1 presents one of the many ways we monitor changing levels of U.S. equity valuations. The analysis sorts and ranks the current and historical expensiveness of the S&P 500 based on a valuation metric known as the Shiller PE.3 This is one of our favorite metrics because it accounts for the ebbs and flows of a complete business cycle as well as the impact of inflation. As shown, the S&P 500 is currently in the highest ventile (one-twentieth) group of expensiveness. In other words, it has been less expensive at least 95% of time. In fact, the S&P 500 is more expensive now than preceding the Global Financial Crisis (GFC). Indeed, the only time investors were willing to pay more for a fractional stake in the 500 companies was at the peak of the Technology, Media and Telecommunications bubble (TMT). Although there may still be some remaining outs, U.S. equities represent an obvious, unnecessary and avoidable risk, which is why we have been selling them into the strength of the market.
The great flood (of liquidity)
So how did equities get to this treacherous position? We have regularly complimented the G4 economies — the United States, Europe, Japan and England — for their swift, decisive and substantial response to the GFC. Things were bad, really bad: Economic growth was plummeting, millions of people were unemployed, and trillions of dollars of wealth were lost. But things would have gotten much worse were it not for the coordinated and sustained intervention by the central banks of these countries. Each dramatically lowered borrowing rates and launched extensive security purchasing programs, typically buying longer-dated government bonds.4 Collectively, these initiatives were designed to flood the economic and financial systems with liquidity. They worked swimmingly well. Growth and employment have been buoyed, along with virtually all asset prices, especially those of global equities.

Figure 2 compares the aggregate balance sheets across the four central banks to the price level of global equities since the GFC. The banks’ securities purchases appear to have been a key factor in propelling and prolonging the rally in equities. The challenge going forward, however, is to understand how equities are likely to perform as the liquidity flood dissipates from the financial system. The Federal Reserve has already begun implementing plans to reduce its massive balance sheet. Other central banks, except for the Bank of Japan, have slowed the pace of buying activity and could very well cut their security holdings in the months ahead. Accordingly, we think it’s a near certainty that interest rates will rise, growth will turn sluggish, and equities will struggle as the process unfolds.
The sucker in the room
A professional investor (player) is highly unlikely to continue betting when the odds are overwhelmingly stacked against them.5 Rather, they are apt to sell expensive assets (fold) and preserve as much of their capital (bankroll) as possible. Investors (like players), who are unwilling or unable to properly assess risks (odds) in the marketplace (casino) are often referred to as the “sucker in the room.”6
Lacking skill, these investors tend to rely on their instincts, believing they will be well-served by doing so. However, their instincts tend not to be epiphanies. Rather, they are almost always related to one or more of the following basic and flawed investing strategies:7
Performance Chasers
This investor tends to “chase performance,” making investment decisions based on the recent past by increasing investments that have done well, while decreasing those that have done poorly. They believe markets are always efficient so current prices reflect all available information and accurately indicate future value. As such, they tend to have little concern over changing levels of risks. They consider investing to be a game of pure chance, with every investor equally likely to win or lose.
Speculators
Any of the four types of investors may suffer from a fear of missing out, but speculators are most susceptible to this affliction. They tend to believe the unbelievable — that prices will continue to rise and become further detached from fair value. They look for reasons to justify why “this time it’s different.” Believing in the “greater fool theory,” they hope someone with less investment acumen will bail them out of their bad decisions. They may even become day traders, thinking they can outwit most people on most days. They tend to hold individual stocks (or cryptocurrencies) that have been “hot.”
Market Timers
Market timers generally have some broad notion that securities are overvalued or undervalued. They believe this information arms them with remarkable foresight to exit the market at or near its peak and return just as it has reached its bottom. In practice, however, they are rarely able to effectively execute their strategy, certainly not over multiple market cycles. As a result, they often find themselves grossly underinvested and realize returns that lag a passive benchmark over an extended period.
Day Dreamers
These “bad students” frequently forget the lessons they should have learned throughout the course of their investing careers. They apply “revisionist history,” misremembering the devastating damage caused by expensive markets or wonderful opportunities created by inexpensive markets. As such, they experience recidivism — often paying a high price to relearn lessons.
Learning from legends
Still not convinced that skill is the key differentiator between pros and suckers? Still believe markets are always efficient and, therefore, successful investing simply requires being fully invested, with no need to manage risk? Ask yourself, how on earth is it possible that market bubbles and the ensuing crises occur much more frequently than should be statistically plausible?
Then, ask yourself two more questions:
Q1: How could anyone forecast future investment returns?
In March 2000, Yale University professor Robert Shiller published a book, “Irrational Exuberance,”8 in which he predicted the collapse of the TMT. Subsequent editions of the book predicted the housing bubble of the mid-2000s, as well as the GFC. In 2013, Shiller was honored as a co-recipient of the Nobel Memorial Prize in Economic Sciences for laying “the foundation for the current understanding of asset prices.” His work, including the development of the Shiller PE, was specifically noted for having “identified a variety of variables that forecast future stock returns.”
Figure 3 displays the power9 of the Shiller earnings yield to predict average annualized returns over the following 10 years. Clearly, Shiller’s approach has been a remarkably good predictor of future investment returns. Today, his framework suggests just a 2.5% average annualized return for the S&P 500 over the next 10 years.

Our Capital Market Expectations (CMEs) follow a very similar framework. However, we forecast future returns for dozens of asset classes to construct globally diversified portfolios designed to generate attractive risk-adjusted returns over the long term.
Q2: Why would anyone hold cash?
Berkshire Hathaway is currently holding a record $119 billion in cash and equivalents. In his 2017 annual shareholder letter, Chairman Warren Buffett reminded shareholders about the qualities he and Vice Chairman Charlie Munger look for when making investments:
- A business with durable competitive strengths
- Skilled management
- Attractive returns on operating assets
- Opportunity for growth
- A sensible purchase price
He went on to write, “That last requirement proved a barrier to virtually all deals we reviewed in 2017, as prices for decent, but far from spectacular, businesses hit an all-time high.”
Accentuating his view on valuations, Buffett apparently doesn’t even find Berkshire Hathaway stock an attractive investment right now. He’s said he would consider using cash for share buybacks, but only up to a valuation level of 1.2 times book value. The stock currently trades at 1.5 times book value.
Warren Buffet’s Investing Tips
- Rule No. 1: Never lose money. Rule No. 2: Never forget Rule No. 1.
- Risk comes from not knowing what you’re doing.
- Price is what you pay. Value is what you get.
- What the wise do in the beginning, fools do in the end.
- Be fearful when others are greedy. Be greedy when others are fearful.
The dangerous lure of leverage
While some industry legends believe equities are overvalued, others appear content to maintain, and even leverage, their exposure. As a reminder, leverage has the effect of amplifying a portfolio’s returns (making good returns better and bad returns worse).
Figure 4 displays the level of margin borrowing during the peak and trough of the TMT and GFC. In each of those instances, investors increased margin when valuations were high and then decreased margin when valuations were low. That’s the exact opposite of what a professional investor would recommend, but nevertheless it happened.
Today is no exception. Investors have borrowed approximately $600 billion to lever up their portfolios. Although that amount represents a seemingly low percentage of the $24 trillion10 overall equity market capitalization, margin by any measure currently stands at an all-time high.

The chart also makes it quite clear that margin debt has grown dramatically over the years. A takeaway is that we seem to be migrating towards a society of aggressive risk takers as opposed to rigorous risk managers. What’s more disturbing is that our appetite for risk seems to grow at the precise time that it should wane. Unfortunately, like casinos, the investment industry has no shortage of junkets, hosts or shills11 who are willing to extend the next marker,12 even knowing the unskilled player is bound to lose.
Paying the price
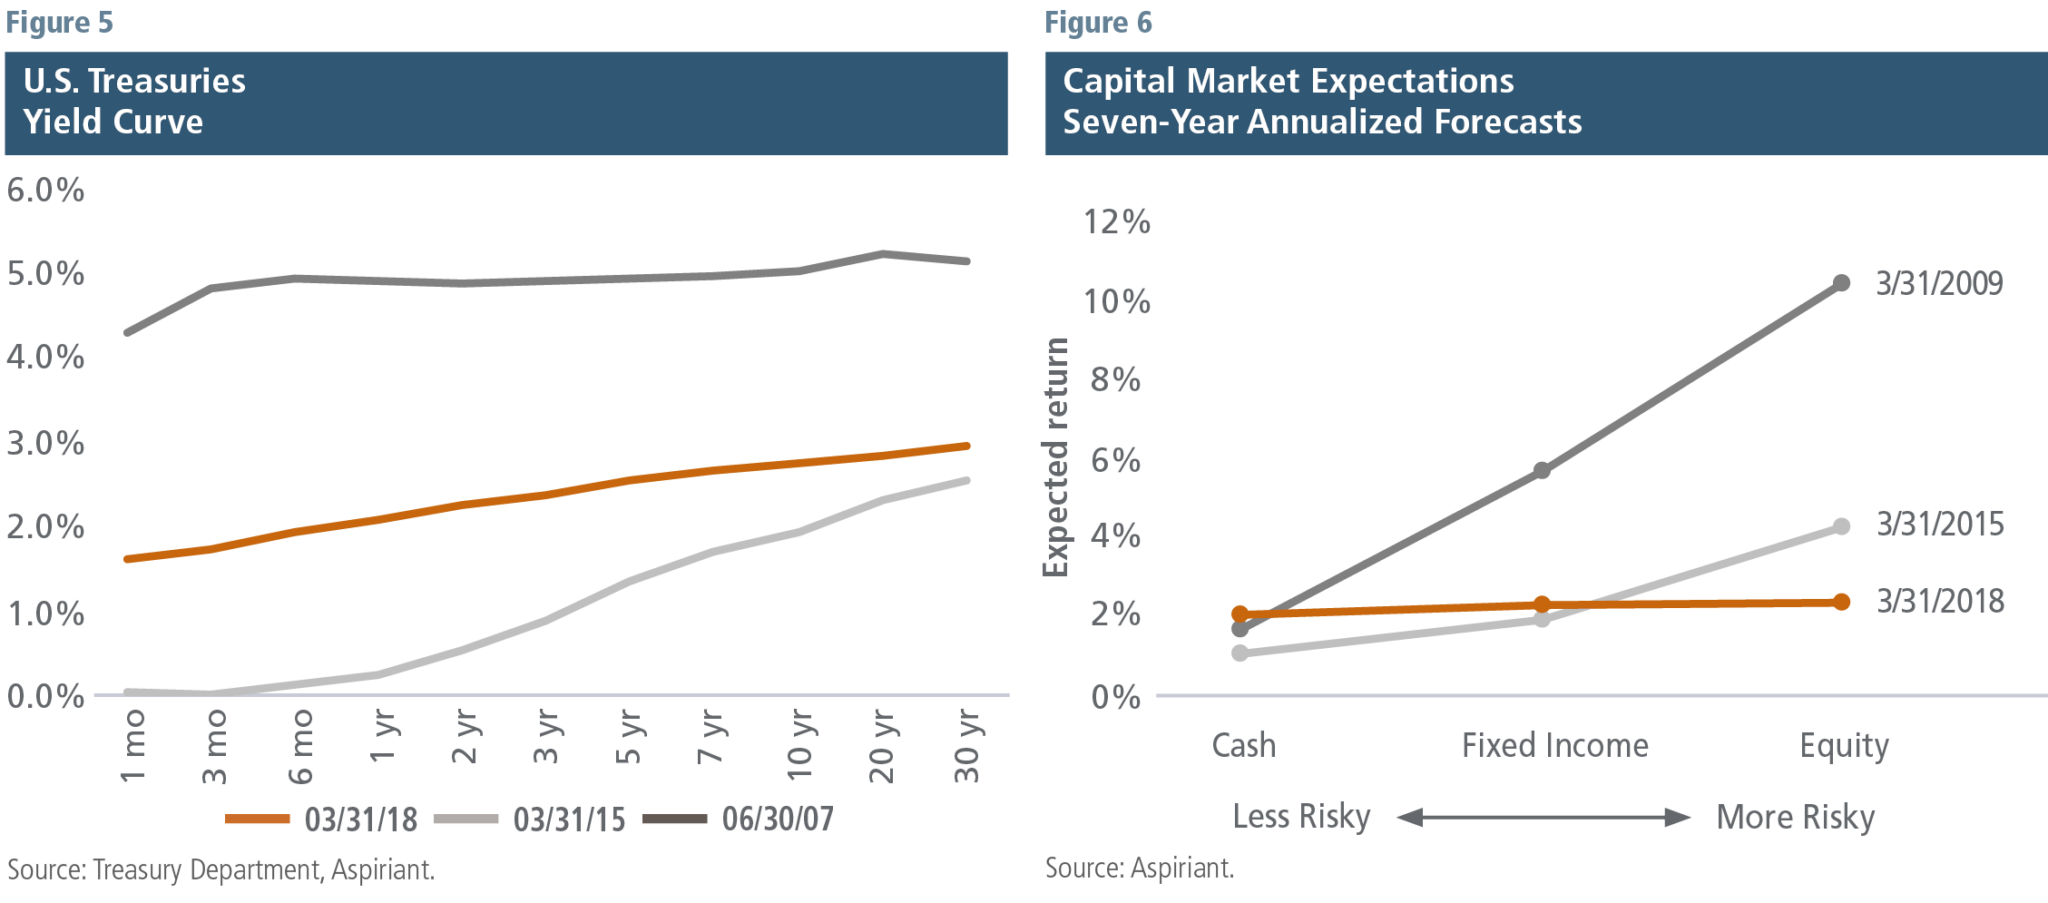
Okay, so margin is at an all-time high. Now, if interest rates remained low and expected returns were high, we probably wouldn’t have any cause for concern. However, as shown in Figures 5 and 6, rates have already begun to rise13 at the same time that forward-return expectations appear discouraging. Consequently, we believe it’s much more likely that margin will begin to amplify losses as opposed to gains. Investors taking these risks should be prepared to pay a potentially steep price if and when the market corrects.
Play the hand you are dealt
By artificially holding interest rates down over the past several years, central bankers engineered a landscape that was exceedingly receptive to risk-taking: low and falling interest (discount) rates, marginal but stable inflation and growth, subdued market volatility, and negligible returns on cash and other safe assets. Risk takers, almost uniformly, have been handsomely rewarded. But as conditions evolve and drift away from that unusually fertile past, we expect materially different outcomes for investors. We believe the winners over the next several years will be those who preserve gains, protect capital and fortify a portfolio’s defensive positioning. Conversely, the suckers will continue to overextend themselves, press their luck with equities and margin, and eventually squander their outs and draw dead.
Footnotes:
1We refer to our forecasting outputs as Capital Market Expectations (CMEs) and monitoring tools as financial EKGs.
2We tend to focus our efforts on analyzing new information related to future cash flows and prevailing valuation levels.
3The Shiller PE is calculated as the current market capitalization of the S&P 500 divided by the average, inflation-adjusted earnings of the companies over the trailing 10 years.
4Quantitative Easing (QE) has been implemented differently across countries. It usually entails the purchase of government and federally sponsored or backed agency debt but can also include the purchase of other securities.
5An exception in poker is a player may try to bluff their opponent into folding a superior hand.
6The aphorism has been used to describe gambling and investing going back to at least the early 1970s. Warren Buffett used a variant in his 1987 annual shareholder letter.
7Any of the four strategies often confuse the strength of the economy with the strength of financial markets.
8The book’s title is credited to a quote by Alan Greenspan, who was chairman of the Federal Reserve at the time.
9Among others, Professor Jeremy Siegel of the Wharton School at the University of Pennsylvania has argued that changing accounting standards over the years resulted in lower reported earnings and, therefore, higher price-to-earnings ratios. We find merit on the impact for the average level of valuations over time, but our process is most concerned with outlier valuations at the extremes.
10As of December 29, 2017.
11Junkets are independent promoters who bring gamblers to casinos in exchange for a portion of the amount gambled. Hosts are similar to junkets, but are typically employed by one casino. Shills accompany high-stakes gamblers, typically signing markers to provide anonymity to the gambler.
12A marker is a signed slip of paper representing an agreement for a casino to extend credit (more chips) in exchange for the gamblers’ promise to repay the marker with interest.
13For example, the Federal Reserve has enacted five quarter-point increases to the federal funds rate over the past nine quarters, taking the target rate from 25 bps – 50 bps to 150 bps – 175 bps.
Illustration by Ken Cummings
Important disclosures
Past performance is no guarantee of future performance. All investments can lose value. Indices are unmanaged and you cannot invest directly in an index. The volatility of any index may be materially different than that of a model.
Equities. The S&P 500 is a market-capitalization weighted index that includes the 500 most widely held companies chosen with respect to market size, liquidity and industry. The Russell 2000 Index measures the performance of the small-cap segment of the U.S. equity universe. It is a subset of the Russell 3000 Index representing approximately 10% of the total market capitalization of that index. It includes approximately 2000 of the smallest securities based on a combination of their market cap and current index membership. The MSCI EAFE Index (Europe, Australasia, and Far East) is a free float-adjusted market capitalization index that is designed to measure the equity market performance of developed markets, excluding the U.S. and Canada. The MSCI Emerging Markets Index is a free float-adjusted market capitalization index that is designed to measure equity market performance of emerging markets. The MSCI ACWI Index is a free float-adjusted market capitalization weighted index that is designed to measure the equity market performance of developed and emerging markets. The MSCI ACWI GR Index approximates the maximum possible reinvestment of regular cash distributions (cash dividends or capital repayments). The amount reinvested is the cash distributed to individuals resident in the country of the company, but does not include tax credits. The MSCI ACWI NR Index approximates the minimum possible reinvestment of regular cash distributions. Provided that the regular capital repayment is not subject to withholding tax, the reinvestment is free of withholding tax. Effective December 1, 2009, the regular cash dividend is reinvested after deduction of withholding tax by applying the maximum rate of the company’s country of incorporation applicable to institutional investors.

 Talk to us
