
Quarterly Letter
If you fail to plan, you are planning to fail1
Like coaches, portfolio managers must have a well-conceived game plan as well as a versatile starting lineup. Last year, we published three seminal Insights describing our investment philosophy. One of the three centered on our Capital Market Expectations (CMEs),2 which are forward-looking investment return expectations by asset class.3 Our framework (i.e. our game plan) is grounded upon one of the most basic concepts in investing: return on investment (ROI).4 ROI is simply the average annualized cash flow earned by an investor divided by the principal investment. For example, the ROI of a one-year certificate of deposit paying 1.25% in interest is 1.25%, assuming the bank5 makes good on returning the principal after one year. Pretty straightforward, right? Well, it certainly is for short-term, fixed payment investments. However, it becomes much more challenging to estimate ROI as the cash flows change and the asset price fluctuates. Our CME framework is specifically designed to accommodate these movements, creating a game plan that flexibly adapts to changes in the investment environment. The framework guides our asset allocation decisions, moving portfolios toward (or away from) asset classes we believe are more likely to outperform (or underperform) over the next market cycle (i.e. seven years). Like winning a game, the overarching goal of the portfolio shifts is to increase the likelihood that our clients achieve their long-term financial planning goals.
“Stuff” happens and slim pickings
If investment markets were perfectly and perennially efficient, investors would share the same outlook. As a result, investors would uniformly act with perfect prescience. Investment environments would never be characterized by peaks or troughs, bubbles or bursts. Instead, investing would be . . . well, boring. And, that’s the way it should be. In an efficient market, ROI would equal fair value (described below) and investors would never overpay nor underpay for the streams of cash flow associated with any security. Unfortunately, many investors lack the framework, skill and/or time to properly estimate forward-looking ROI across multiple asset classes. Instead, they often look to the past (and the recent past at that), or succumb to a host of other behavioral biases, to inform their portfolio allocation. They assume the winners will continue to be the winners; and the losers will continue to be the losers. For example, many investors today have portfolios concentrated in U.S. equities. To us, that makes little sense. Although we don’t see many good investment opportunities today, our framework suggests there are better ways to earn a reasonable portfolio return than overweighting U.S. equities.
CME Refresher: Cash Flow and Valuation Impact
The ROI of any security consists of two, and only two, components: cash flow and valuation impact. For equities, the cash flow is either paid by companies directly to shareholders or reinvested with the expectation of earning more profits. We refer to the cash flow return as “fair value” because it represents the portion of the return investors are entitled to receive for being residual owners in a company. Our CMEs start by forecasting fair value for each asset class and then applying a valuation impact, which is determined by market forces. Over a market cycle, the valuation impact can either act as a tailwind or headwind to investment returns. The following chart compares our fair value return expectations with our CMEs (which include the valuation impact).
Fair Value vs Current CMEs
March 2017
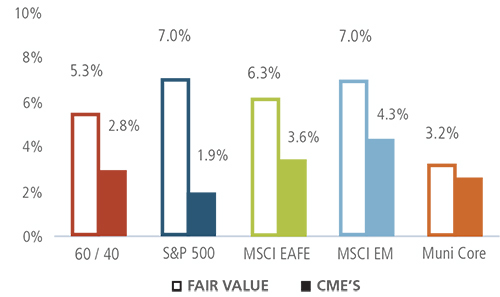
As shown, the CME for each asset class is lower than its fair value return, meaning we’re expecting valuations to compress going forward and therefore erode away part of the returns. In other words, each of the financial asset classes is expensive relative to its long-term history. If, equity prices outpace cash flow growth over an extended period of time, which is precisely what has happened since the Global Financial Crisis (GFC), then forward returns must come down. We are not alone in our views. In fact, a number of the most reputable investment firms in the asset management industry have similar views, including Vanguard, PIMCO, GMO, Research Affiliates, Baupost and Bridgewater.
Bigger isn’t always better
By our lens, a passive global balanced portfolio currently has an expected annualized return of 2.8% over the next seven years. Not only is the estimate below our fair value estimate of 5.3%, it is well below our absolute annualized return objective of 6.0%.6 More importantly, an annualized return of 2.8% over the next seven years will likely fall well short of investor expectations. This is precisely why we have been warning about the dangers of investing in static, low-cost market cap weighted portfolios going forward. Although they have performed well since the trough of the GFC and onset of quantitative easing, we expect them to underperform over the next market cycle.7 Why? Because the very way they achieve their low-cost structures is by intentionally increasing their weightings to the largest stock and bond issuances.8 Aspiriant’s CME framework weights its portfolios based on expected ROI relative to the expected risk of each asset class. As a result, we expect our portfolios to be less susceptible to the ebbs and flows of the overall market, resulting in greater stability and a higher likelihood of meeting long-term financial planning objectives.
Achieving objectives requires tilts, discretion and dispersion
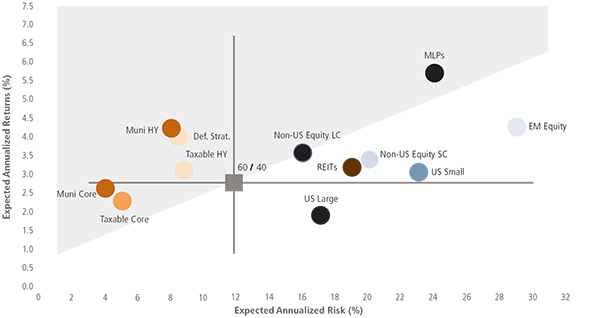
So, what’s our game plan for achieving our investment objectives? First, we use our CMEs to tilt our portfolios toward the asset classes with the highest expected returns (and away from those with the lowest expect returns).9 Second, we need the discretion to fully implement the tilts and act on behalf of our clients in a timely fashion. On this latter point, we are not market timers and don’t believe any investor has demonstrated repeatable skill when it comes to market timing. However, we also cannot be hamstrung by significant time delays that can limit our ability to take advantage of an opportunity. Finally, we need an environment characterized by dispersion, meaning different return/risk expectations across asset classes. “Luckily,” most environments exhibit dispersion, including the current environment (see scatter plot below). The differences in the return/risk expectations allow us to move toward the most favorable asset classes and away from the least favorable ones.
We expect asset classes above the horizontal line to generate higher returns than a passive 60/40 portfolio. We expect asset classes in the gray shaded area to generate better risk-adjusted returns than a passive 60/40 portfolio. Our CME framework tends to make our portfolio allocations really quite intuitive to understand. Below, we highlight three of our existing allocations, providing additional context and support for the decisions we’ve made.
Aspiriant CMEs: 7 Year Expectations
Equities: Fewer headwinds outside of the U.S.
No asset class is ordained to win in all environments. Since the GFC, U.S. equities have set an all-time relative record, outpacing European equities by +113%.10 We believe three primary factors drove this result: i) the substantially greater impact of monetary stimulus deployed by the Federal Reserve in the United States, ii) the European Central Bank’s decision to enact austerity measures following the GFC and iii) the strengthening of the U.S. dollar.
U.S. equity outperformance, including better demographics, ongoing innovation and stronger institutions. However, these are unlikely to sustain the relative outperformance going forward.
S&P 500 vs European Equities10
Cumulative Relative Wealth

Bonds: We don’t love ‘em, but we don’t hate ‘em, either
Three years ago, we recommended that clients add or increase fixed income,11 which has been a positive contributor to performance. For the three years ending December 31, 2016, global equities generated an annualized return of +3.1%12 whereas municipal bonds delivered +4.1%13. And, municipal bonds are exempt from federal taxation. So, municipal bonds have contributed nicely to overall portfolio returns. However, municipal bonds are also expensive today, with an expected annualized return of just 2.6% over the next seven years. So, why not just “go for the gusto” by reducing fixed income and increasing other higher returning assets? Because fixed income tends to provide significant downside protection. And, given our concerns about overall valuation levels, capital preservation may very well prove its mettle.
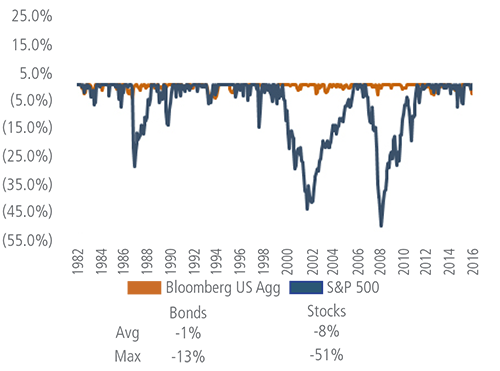
The following chart displays the maximum drawdown, or maximum negative return, of bonds and equities since the 1980s. Since then, equities have experienced several pullbacks of at least 15% whereas bonds have never experienced a pullback that severe. The combination of relatively attractive expected (after-tax) returns combined with their protective properties has led us to neutral weight bonds across our portfolios.
Maximum Drawdown
Bonds vs. Stocks
Defensive Strategies: Boring is beautiful
Notwithstanding the devastation that occurred during the GFC, we wish we were back in March 2009. Eight years ago, was an incredibly attractive time to be an investor. From our perspective, virtually every financial asset class was on sale. And, for those who had the dry powder, investing was like shooting fish in a barrel. Unfortunately, we are not in that environment today. The market has rallied, portfolios have ballooned and forward-looking returns seem to be well below historical averages. So, when everything appears to be expensive, what additional portfolio tilts make sense? Answer: defensive strategies. In December 2015, we added the fifth of the five primary building blocks we use to construct portfolios: equities, defensive equities, fixed income, real assets and defensive strategies. In a nutshell, defensive strategies are designed to have little movement with equities or fixed income, whether they go up or down. Indeed, they are boring; and we have intentionally positioned them that way.
The following charts14 illustrate what we mean. The left-hand side compares defensive strategies to equities. During months when equity returns were positive, their average return was +3.4%, and defensive strategies averaged +1.4%. During months when equity returns were negative, their average return was -3.4%, while defensive strategies averaged -1.0%. Likewise, the right-hand side compares defensive strategies to fixed income. During months when fixed income returns were positive, their average return was +0.9% and defensive strategies averaged +0.4%. During months when fixed income returns were negative, their average return was -0.8%, while defensive strategies have been positive +0.6%.
Monthly Investment Returns14
January 2002 through March 2017

During periods (like today) in which equity valuations appear stretched and fixed income may face near-term pressure, we believe a meaningful allocation to defensive strategies will not only serve to reduce portfolio volatility (and drawdown), but will also act as a positive contributor to overall returns.
As always, we will continue to actively monitor the investment environment and will communicate any changes in our outlook and portfolio positioning as they occur. In the meantime, reach out to your registered investment advisor to discuss this further.
Print this page here.
Footnotes:
1 Original citation of the widely used quote has generally been attributed to Benjamin Franklin.
2 For a broader discussion, please see our CME Insight published in March 2016.
3 Technically, our CMEs encompass expected return, risk and correlation (or the relationship between asset classes).
4 We use “return on investment” in a broad sense. There many variations of the concept, including internal rate of return (IRR) and time weighted return (TWR). Each analyzes cash flow relative to principal/equity investment.
5 The “bank” may also mean Federal Deposit Insurance Corporation on amounts up to $250,000.
6 Our Moderate Portfolio has two stated return objectives over a complete market cycle: a 60/40 passive portfolio and a CPI+ 4.0% absolute return. Our current assumption for CPI is 2%.
7 From 1900 to 2016, a market-cap weighted, passive U.S. balanced portfolio struggled to generate a positive real return in 76 out of the 116 years of history. Source: Global Financial Data, Aspiriant.
8 Passive portfolios achieve their low-cost structures by relying on computer-based algorithms to rebalance their exposures toward those provided by index providers such as S&P, MSCI, and Russell.By and large, the index providers weight the underlying securities based on the market capitalization or size of issuance.
9 The chart displays the relative cumulative performance of the S&P 500 versus the MSCI EAFE ex-Japan Index.
10 Technically, our allocation process evaluates expected return, risk and correlation across asset classes.
11 We first recommended adding/increasing fixed income in our CME Insight published in December 2014.
12 Total annualized return for the MSCI ACWI Index.
13 Total annualized return for the Barclays Municipal Bond Index.
14 Sources: Morningstar, Bloomberg and Aspiriant. Global Equity returns represented by the MSCI All Country World Index (ACWI). Defensive Strategy returns represented by the HFRI Fund Weighted.Composite Index. Fixed Income returns represented by the Bloomberg Barclays Municipal 1-15 Year Index. Data as of 3/31/2017.
Important disclosures:
The information in this article is created by Aspiriant and should not be considered investment advice or a recommendation to adopt any investment strategy. The opinions expressed are as of April 18, 2017, and are subject to change. Consult your personal investment advisor before buying or selling any securities.
Past performance is no guarantee of future performance. All investments can lose value. Indices are unmanaged and it is impossible to invest directly in an index. The volatility of any index may be materially different than that of a model.
Equities. The S&P 500 is a market-capitalization weighted index that includes the 500 most widely held companies chosen with respect to market size, liquidity and industry. The Russell 2000 Index measures the performance of the small-cap segment of the U.S. equity universe. It is a subset of the Russell 3000 Index representing approximately 10% of the total market capitalization of that index. It includes approximately 2000 of the smallest securities based on a combination of their market cap and current index membership. The MSCI EAFE Index (Europe, Australasia, and Far East) is a free float-adjusted market capitalization index that is designed to measure the equity market performance of developed markets, excluding the U.S. and Canada. The MSCI Emerging Markets Index is a free float-adjusted market capitalization index that is designed to measure equity market performance of emerging markets. The MSCI ACWI Index is a free float-adjusted market capitalization weighted index that is designed to measure the equity market performance of developed and emerging markets.
Fixed Income. The Barclays U.S. Aggregate Index represents securities that are SEC-registered, taxable and dollar denominated. The index covers the U.S. investment grade fixed rate bond market, with index components for government and corporate securities, mortgage pass-through securities and asset-backed securities. These major sectors are subdivided into more specific indices that are calculated and reported on a regular basis. The Barclays Municipal Bond Index is a rules-based, market-value-weighted index engineered for the long-term tax-exempt bond market. The index has four main sectors: general obligation bonds, revenue bonds, insured bonds and pre-refunded bonds. The Barclays High Yield Municipal Bond Index is an unmanaged index composed of municipal bonds rated below BBB/Baa.
Real Assets. The S&P GSCI® is a composite index of commodity sector returns representing an unleveraged, long-only investment in commodity futures that is broadly diversified across the spectrum of commodities. The returns are calculated on a fully collateralized basis with full reinvestment. Wilshire Global RESI is a broad measure of the performance of publicly traded global real estate securities, such as Real Estate Investment Trusts (REITs) and Real Estate Operating Companies (REOCs). The index is capitalization-weighted. The Alerian MLP Index is a gauge of large and mid-cap energy Master Limited Partnerships (MLPs). The float-adjusted, capitalization-weighted index includes 50 prominent companies and captures approximately 75% of the available market capitalization.

 Talk to us


