Stitching the seam
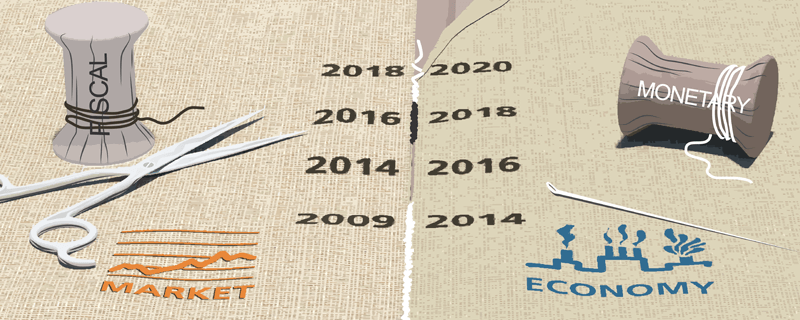
A financial security represents a claim on the future cash flow generated by an asset or collection of assets, whether owned by a business or government. These securities, in aggregate, constitute our capital or financial markets. Similarly, the assets tied to these securities represent the productive capacity of the country. So, the fabric between financial markets and the real economy should be tightly woven together. However, while most economies tend to be reasonably stable, markets can be tugged and pulled in different directions, especially as investor emotions shift between greed and fear. At times, the tensions can rip through the fabric, requiring central government intervention to stitch the pieces back together.
We believe the Global Financial Crisis (GFC) was one such event. Since then, the U.S. government has used a combination of accommodative monetary and fiscal policies to repair and strengthen financial markets, as well as the overall economy. However, at this point, we believe each spool is nearly out of thread, limiting the government’s ability to reattach the pieces in the event of another severe downturn.
What did I miss? A whole lot of nothing
If you were disengaged from the financial markets between September and March, you’d probably think that the investment environment was quite calm. The closing price of the S&P 500 was 2914 on September 30 and 2834 on March 31. That outcome would have probably disappointed you but wouldn’t leave you panicked or unnerved.
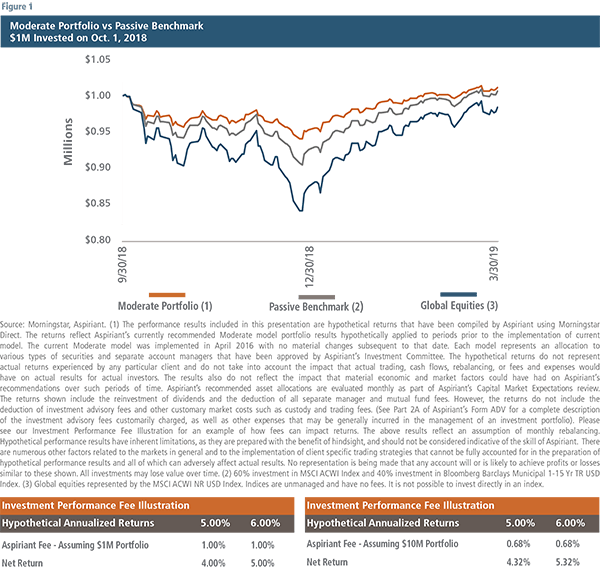
However, during your six-month hiatus, you actually missed a lot of excitement. As shown in Figure 1, global equities closed down on 34 of 60 trading days between October 1 and December 23 and approached bear-market territory, suffering a maximum drawdown of 15.8%. Then, markets began to quickly recover, eventually ending the six-month period at a loss of 1.6%.1 A global balanced portfolio2 fared better, experiencing a drawdown of 9.5% and eventually generating a positive return of roughly 0.6%. By comparison, our moderate portfolio, which currently is defensively positioned, had a more muted drawdown of just 5.9% and ended the six months up 1.1%.
We are long-term, value-oriented investors. As such, we tend not to get overly preoccupied by short-term performance, whether good or bad. However, we are pleased with our portfolios’ performance over this period of undulating markets. And, we believe it is emblematic of what investors should generally expect over the next several quarters as the market wrestles with weakening fundamentals and the increasingly limited tools available to central governments to arrest a sharp drop in economic activity.
We prefer steady over queasy
Since late 2014, we have tilted our portfolios away from equities and toward fixed income, among other defensive allocations. We believed then, as we do now, that fixed income would offer a similar investment return to equities over a complete market cycle, but with substantially less risk, especially drawdown risk.
As shown in Figure 2, the return pattern of global equities3 has been quite uneven. From September 2014 through mid-2016, equities trailed fixed income by a wide margin. Then, the outcome of the U.S. presidential election raised investor expectations for policy shifts, including tax cuts, causing equities to race ahead of fixed income during the next few quarters. However, in the fourth quarter 2018, equities sold off so severely that they once again underperformed fixed income over the entire four-year period commencing in September 2014.
Thus far in 2019, equities have recouped the losses suffered in 2018 and are once again ahead of fixed income. We do not believe the reversals are behind us. Slowing economic growth, a narrowing set of policy responses, and margin pressures will unmask the underlying risks of equities and upend the return paths yet again. In our estimation, the reward for owning equities at these levels is far too slight for the risks assumed.
Before discussing what we think will happen and why, it’s probably best to review what has happened and why. Doing so enables us to understand the forces at play, including the degree to which future policy shifts will likely influence equity returns going forward.
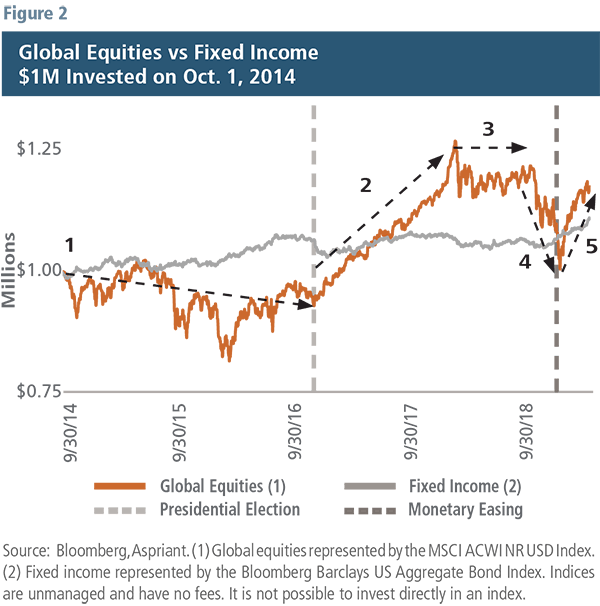
Figure 2 includes five dashed black arrows to help explain the performance of global equities during specific subperiods in which monetary or fiscal policy changed.
1) Monetary tightening4 begins, with the Fed signaling its intent to normalize policy and raise interest rates.
2) Anticipated fiscal stimulus5 more than offsets the effects of modest monetary tightening.
3) Monetary tightening roughly offsets the benefit of the fiscal stimulus.
4) Monetary tightening overpowers the impact of waning fiscal stimulus.
5) Monetary easing boosts the impact of waning fiscal stimulus.
Fed: Running out of thread
In our Third Quarter 2018 Insight, we discussed “what keeps us up at night.” We said we expected to protect significant capital in the event of a downturn because of our defensive positioning. So, when the fourth quarter selloff occurred, we were confident that our portfolios would compare favorably. We also identified three catalysts6 that could help the market advance higher. One of those was the Federal Reserve changing course on policy normalization and instead reducing (or to a lesser degree maintaining) current interest rates. That’s precisely what the Fed signaled earlier this year by deciding to “pause” on increasing short-term interest rates and pulling forward the end date for the run-off of its holdings of U.S. Treasury and mortgage securities. Going into the fourth quarter of last year, market expectations were for the Fed to hike short-term rates over the next 12 months by about 0.50%. As we leave the first quarter of this year, the market now anticipates that the Fed will reduce short-term interest rates by about 0.25% over the next year. In effect, the Fed eased by 0.75% over the last several weeks — that pivot sparked the recent recovery in U.S. markets.
As a reminder, lower rates (including the Fed’s decision to maintain their current relatively low levels) allow consumers to borrow more, which enables them to spend more. And, since one person’s spending is another person’s income, jobs are created. Moreover, lower rates encourage companies to borrow more, which enables them to spend more. And, since one company’s spending is another company’s revenue, corporate earnings are buoyed. Overall, lower interest rates result in elevated levels of economic growth, corporate profitability and, therefore, higher expected equity returns.
Notwithstanding the Fed’s decision to stimulate, consumption, production and employment all point to lower levels of economic growth. In fact, we estimate U.S. Gross Domestic Product (GDP) growth will likely slow from about 3% in 2018 to about 2% (or less) in 2019. At the same time U.S. economic growth decelerates, global growth is also trending lower. The World Bank now projects world GDP growth of about 3% for 2019, well below the cycle average of 4% and the lowest of the recovery. Moreover, last quarter we shared our concerns that corporate earnings would likely fall short of analyst expectations over the next couple of years. The combination of lower-than-expected economic growth and record profit margins makes high single-digit earnings growth a stretch in our view. Any earnings shortfalls will most assuredly take a toll on equities. As shown in the following charts, we believe the Fed cannot continue to support the financial markets because it needs to preserve its limited remaining options to support the economy in the event of a downturn.
Figure 3 shows short-term interest rates as illustrated by the U.S. federal funds rate. Figure 4 shows long-term interest rates as illustrated by 10-year Treasurys. The Fed can unilaterally set short-term interest rates, as well as act as a well-capitalized market participant that buys or sells securities to influence long-term interest rates. The charts also show the expected level of short7 and long8 interest rates as of September 2018 and March 2019 to capture the change in the period before and after the Fed took a pause on rate increases.
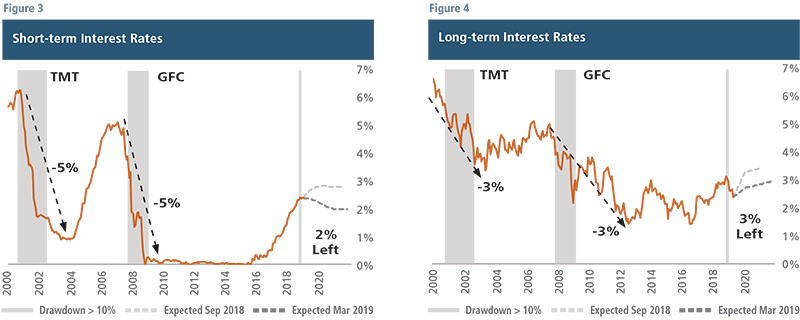
The vertical, gray shaded bars represent periods in which the S&P 500 sold off by at least 10%. The width of the bars represents the time required to recover those losses. For example, during the Technology, Media and Telecommunications (TMT) pullback, equities sold off 49% and took 73 months to recover. During the GFC, equities sold off 57% and took 53 months to recover from that drawdown.
In each case, the agent helping the economy and equities recover was rapid and significant decreases in both short- and long-term rates. In the case of the former, the Fed pulled short-term rates down by approximately 5%. In the case of the latter, the Fed purchased Treasurys and mortgage-backed securities, which helped pull down long-term rates. In fact, during the TMT event, the Fed doubled its ownership of U.S. Treasurys from about 11% to 18% as a percentage of the overall market capitalization. As the Fed pursued three rounds of quantitative easing from 2010 through 2014, its maximum ownership of Treasurys approached 22% of the overall market.9 Given this staggering increase, we ask ourselves, “At what point will the Fed stop purchasing the debt of the country?”
Clearly, the Fed’s pause earlier this year helped limit the depth and duration of the most recent drawdown. However, the Fed partially depleted its spool of available resources to tackle more daunting challenges if and when they surface. A 2% drop in short-term rates is woefully inadequate, by historical standards, to animate spending and move the economy on a path to recovery in the aftermath of a recession. Furthermore, the politics of re-activating quantitative easing, buying financial assets and manipulating long-term rates lower also appears challenging at best, and untenable at worst. As such, our baseline assumption is that U.S. long-term rates will remain stubbornly above 0%. But we acknowledge stranger things have happened — see Europe and Japan as prime examples.
Liquidity Dial: Stuck at 12 o’clock?
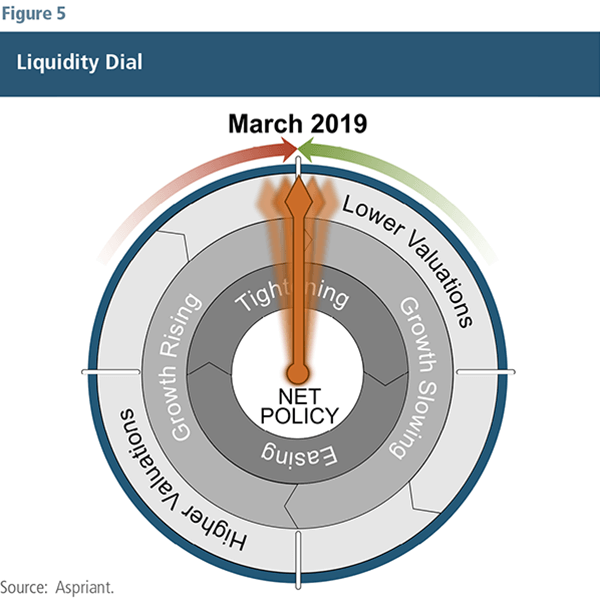
Understanding the impact of government stimulus on economic growth, as well as asset valuations, is critical to understanding what’s likely to occur in the future. Government stimulus has a direct relationship with economic growth and an indirect relationship with asset valuations. We use a liquidity dial (Figure 5) to illustrate the connections between these relationships and show where we are in the current business and market cycles.
We believe we’re entering a period of slowing growth and decreasing profit margins. If the next downturn is worse than expected, the Fed’s levers may be inadequate to rewind the liquidity dial sufficiently to spur growth and sustain profit margins. Moreover, political divisiveness has become ever more contentious, partially due to the widening gap in wealth inequality. The likelihood that politicians will cooperate with each other to pass a large-scale fiscal spending plan (perhaps on infrastructure) has become even more remote. Despite the need, and expected benefits around the country, we don’t believe that either side will be willing to gift wrap a win for the other political party, especially so close to the next election cycle.
We do, however, foresee continued progress on U.S. trade relations with China, which could marginally support asset prices, particularly in the more export-dependent economies of the emerging markets and Europe. In any event, we wouldn’t expect any trade outcome to meaningfully alter the narrative of decelerating growth and heightened equity market risk in the months ahead.
Therefore, we expect our liquidity dial to remain suspended around 12 o’clock — pushed forward by the persistent force of the slowing economy as we move through the late stages of the business cycle, and occasionally pulled backward as the Fed depletes its last bit of thread.
Setting expectations
We use our forecasting framework and monitoring systems to intentionally manage risk throughout complete market cycles. At times, that may mean either increasing or decreasing risk as the environment changes. As we have moved through the later stages of the current market cycle, we have become defensive as we await more inviting opportunities to increase risk. Over the past couple of quarters, that positioning allowed us to compare favorably to our passive benchmarks.
Going forward, we believe the most likely scenario is that equity markets will continue to struggle. Given our positioning, we would expect to keep pace with our passive benchmarks in that environment. Another somewhat likely scenario is markets will suffer a significant selloff. If that transpires, we would expect to protect a significant portion of our clients’ assets through higher allocations to fixed income, defensive equities and diversifiers. The last, and we believe least likely, scenario is equity markets will continue to advance substantially higher. If that scenario unfolds, we would expect our portfolios to generate reasonable absolute returns, albeit lower than our passive benchmarks.
As professional investors, we wish we could outperform in every environment. But we can’t — and we don’t know anyone who has. Instead, we intentionally position our portfolios to perform relatively well given the outcomes we think are likely to occur in the future. As such, we knowingly make trade-offs. For example, today we could position our portfolios to look more like our passive benchmarks. However, doing so would necessarily mean taking risks we believe are imprudent, which could cause intolerable losses. We much prefer to act as a “steady hand of calm” for our clients, patiently but opportunistically earning reasonable rates of return while limiting the depth of downturns that could otherwise impair their portfolios.
Endnotes
1 Calculated as a total return, including price change and the reinvestment of dividends paid during the period.
2 Consisting of 60% global equities and 40% municipal bonds.
3 Global equities represented by the MSCI All Country World Index.
4 Lift-off begins with the first 0.25% increase in short-term rates in Q4 2015. Fed signals end of quantitative easing and a shift toward quantitative tightening.
5 Fiscal stimulus includes the anticipation and subsequent passing of the Tax Cuts and Jobs Act in December 2017, which included a reduction in the U.S. corporate tax rate from 35% to 21%, as well as reduced taxes to encourage the repatriation of cash held overseas.
6 The other two potential catalysts we identified were the introduction of additional fiscal stimulus (perhaps a wide-scale infrastructure plan) and favorable trade agreements, specifically with China.
7 Expected short-term interest rates estimated by the futures markets for the U.S. federal funds rate.
8 Expected long-term interest rates estimated by the futures markets for the 10-year Treasury yield.
9 Source: Federal Reserve. U.S. Treasurys held by the Federal Reserve divided by the outstanding marketable U.S. Treasury securities.
Illustration by Ken Cummings
Important disclosures
Past performance is no guarantee of future performance. All investments can lose value. Indices are unmanaged and you cannot invest directly in an index. The volatility of any index may be materially different than that of a model. The charts and illustrations shown are for information purposes only.
Equities. The S&P 500 is a market-capitalization weighted index that includes the 500 most widely held companies chosen with respect to market size, liquidity and industry. The MSCI ACWI Index is a free float-adjusted market capitalization weighted index that is designed to measure the equity market performance of developed and emerging markets. Defensive Equities are investments in a portfolio of securities that has a similar return profile of an equity benchmark but with lower volatility or risk. Defensive Equities tend to be characterized as (residual interests in) companies with stable profitability, leading market shares, high returns on capital, and low leverage. Defensive Equities exposure can be gained through actively managed mutual funds and separately managed accounts, as well as factor-based passively managed ETFs.
Fixed Income. The Barclays U.S. Aggregate Index represents securities that are SEC-registered, taxable and dollar denominated. The index covers the U.S. in¬vestment grade fixed rate bond market, with index components for government and corporate securities, mortgage pass-through securities and asset-backed securities. These major sectors are subdivided into more specific indices that are calculated and reported on a regular basis.

 Talk to us

